
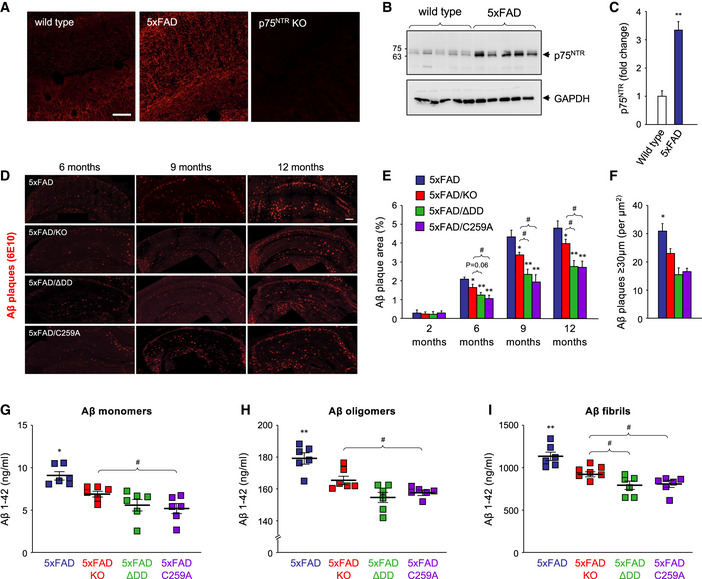
Figure 2. Reduced Aβ content in the hippocampus of 5xFAD mice carrying inactive p75NTR variants.
-
AImmunohistochemistry for p75NTR in hippocampal CA1 of 5‐month‐old wild type, 5xFAD, and p75NTR knock‐out (KO) mice. Scale bar, 20 μm.
-
BWestern blot analysis of p75NTR expression in total lysates of hippocampus from 6‐month‐old wild‐type (WT) and 5xFAD mice assessed using antibody GT15057 against p75NTR extracellular domain (Table S1). The lower panel shows reprobing for GAPDH to control for equal gel loading.
-
CQuantification of p75NTR expression in mouse hippocampus relative to GAPDH. Mean ± SEM; **P < 0.01; N = 5 mice per group (one‐way ANOVA followed by post hoc test).
-
DImmunostaining for Aβ plaques with 6E10 antibody in coronal sections through the hippocampus of 5xFAD, 5xFAD/KO, 5xFAD/ΔDD, and 5xFAD/C259A mice of the indicated ages. Scale bar, 400 μm.
-
EQuantification of Aβ plaque burden in the hippocampus of 5xFAD mouse strains carrying different p75NTR variants as indicated. Histogram shows the percentage of hippocampal area occupied by Aβ plaques (mean ± SEM, N = 5 mice per group). *P < 0.05 and **P < 0.01 versus 5XFAD. #P < 0.05 versus 5XFAD/KO (one‐way ANOVA followed by post hoc test).
-
FQuantification of the number of Aβ plaques larger than 30 µm in diameter per µm2 in coronal sections through the hippocampus of 9‐month‐old 5xFAD, 5xFAD/KO, 5xFAD/ΔDD, and 5xFAD/C259A mice. Color codes are as in panel (E). Histogram shows mean ± SEM, N = 4 mice per group; *P < 0.05 KO versus knock‐in genotypes.
-
G–IELISA determinations of Aβ1‐42 content in hippocampus of 5xFAD mouse strains carrying different p75NTR variants as indicated. Aβ monomers (G) refer to the soluble fraction after Tris‐buffered saline extraction, Aβ oligomers (H) to the soluble fraction after RIPA buffer extraction of the Tris‐buffered saline pellet, and Aβ fibrils (I) to the soluble fraction after formic acid treatment of the RIPA pellet. See Materials and Methods for details. Shown is mean ± SEM; squares denote individual animals. *P < 0.05 and **P < 0.01 versus 5XFAD. #P < 0.05 versus 5XFAD/KO (one‐way ANOVA followed by post hoc test).
Source data are available online for this figure.