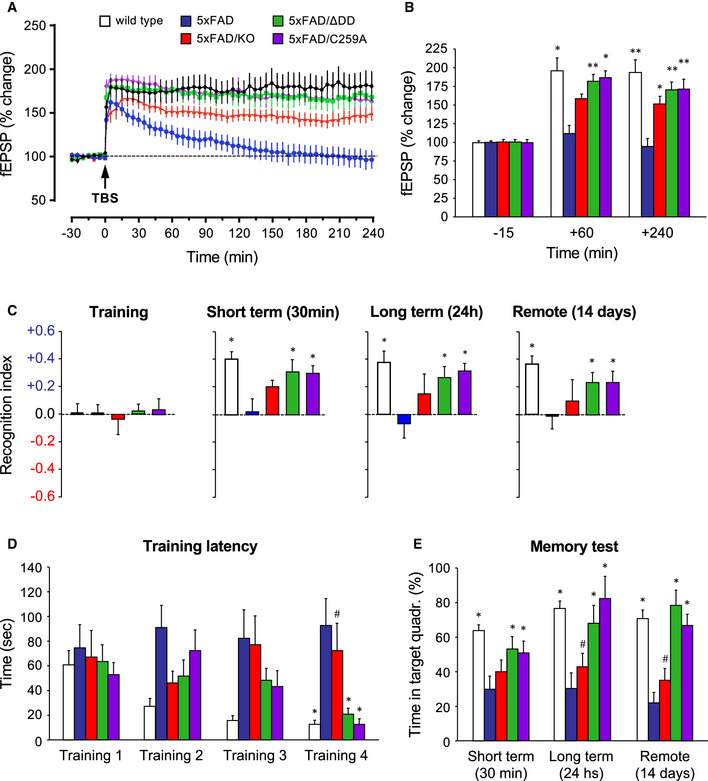
Percentage of change in field excitatory post‐synaptic potential (fEPSP) recorded after theta‐burst stimulation (TBS) in Schaffer collaterals of hippocampal slices from 6‐month‐old wild type, 5xFAD, and 5xFAD/p75NTR mutant mice, as indicated. Results are presented as mean % change normalized to t = 0 ± SEM. N = 6 (wild type), 5 (5xFAD), 9 (5xFAD/KO), 7 (5xFAD/ΔDD), and 8 (5xFAD/C259A) slices from 3 mice per genotype, respectively.
Quantification of fEPSP (mean % change ± SEM) in the indicated genotypes at 3 time points. *P < 0.05; **P < 0.01 versus 5xFAD (two‐way ANOVA followed by post hoc test). N numbers as in (A).
Behavior in the novel object recognition (NOR) test of 6‐month‐old wild type, 5XFAD, and 5XFAD/p75NTR mutant mice, as indicated. Histograms show mean recognition index ± SEM during training, and 30 min, 24 h, and 14 days after training, corresponding to measures of short‐term, long‐term, and remote memory, respectively. Bar color codes are as in panel (A). *P < 0.05 versus 5xFAD (two‐way ANOVA followed by post hoc test). N = 12 (wild type, 5xFAD/ΔDD, and 5xFAD/C259A), 10 (5xFAD), and 8 (5xFAD/KO) mice per genotype, respectively.
Training latency in the Barnes maze test of 6‐month‐old wild type, 5XFAD, and 5XFAD/p75NTR mutant mice, as indicated. Histograms show mean latency in seconds to find the platform hole ± SEM in 4 consecutive training sessions. Bar color codes are as in panel (A). *P < 0.05 versus 5xFAD; #P < 0.05 versus wild type, 5xFAD/ΔDD or 5xFAD/C259A (two‐way ANOVA followed by post hoc test). N = 14 (wild type and 5xFAD/ΔDD), 10 (5xFAD, 5xFAD/KO and 5xFAD/C259A) mice per genotype, respectively.
Percentage of time spent (mean ± SEM) in the target quadrant of the Barnes maze test 30 min, 24 h, and 14 days after training. *P < 0.05 versus 5xFAD; #P < 0.05 versus wild type, 5xFAD/ΔDD, or 5xFAD/C259A (two‐way ANOVA followed by post hoc test). N numbers as in (D).