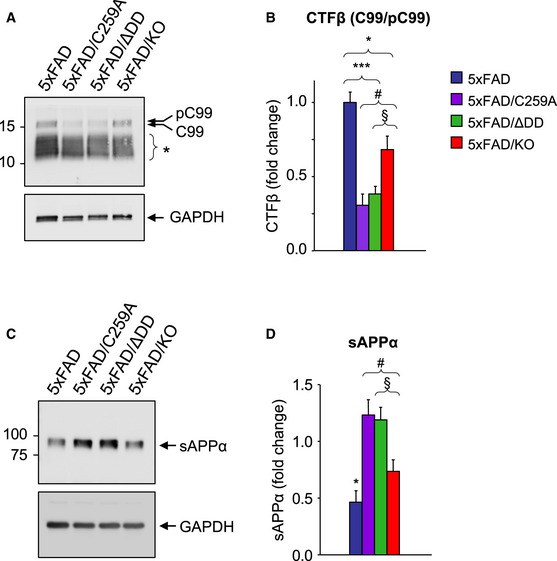
Figure 5. Reduced amyloidogenic processing in hippocampal neurons carrying signaling‐deficient p75NTR variants.

- Western blot analysis of CTF beta (CTFβ) in hippocampal lysates of 9‐month‐old 5xFAD mice carrying different p75NTR alleles detected using anti‐APP‐CTF antibody (A8717, Table S1). Arrows point to phospho‐C99 and C99 CTFβ species as previously assigned by Buxbaum et al, (1998) and Kwart et al, (2019). Asterisk denotes different species of native and phosphorylated alpha and beta CTFs of lower molecular weights (based on Figs 3F and 5A in Kwart et al, (2019)). Lower panel shows reprobing for GAPDH.
- Quantification (mean ± SEM) of phospho‐C99/C99 CTFβ species, normalized to GAPDH and expressed relative to levels in 5xFAD mice. *P < 0.05 5xFAD versus 5xFAD/KO; ***P < 0.001 5xFAD versus 5xFAD/ΔDD and 5xFAD/C259A; #P < 0.05 5xFAD/C259A versus 5xFAD/KO; §P = 0.056 5xFAD/ΔDD versus 5xFAD/KO. N = 5 mice per group.
- Western blot analysis of soluble APP alpha (sAPPα) in the soluble Tris‐buffered saline fraction (see Materials and Methods) of hippocampal homogenate made from 9‐month‐old 5xFAD mice carrying different p75NTR alleles detected using 6E10 antibody (Table S1). Lower panel shows reprobing for GAPDH.
- Quantification (mean ± SEM) normalized to GAPDH and expressed relative to levels in 5xFAD mice. *P < 0.05 5xFAD versus 5xFAD/KO, 5xFAD/ΔDD and 5xFAD/C259A; #P < 0.05 5xFAD/C259A versus 5xFAD/KO; §P < 0.05 5xFAD/ΔDD versus 5xFAD/KO. N = 9 mice per group.
Source data are available online for this figure.
