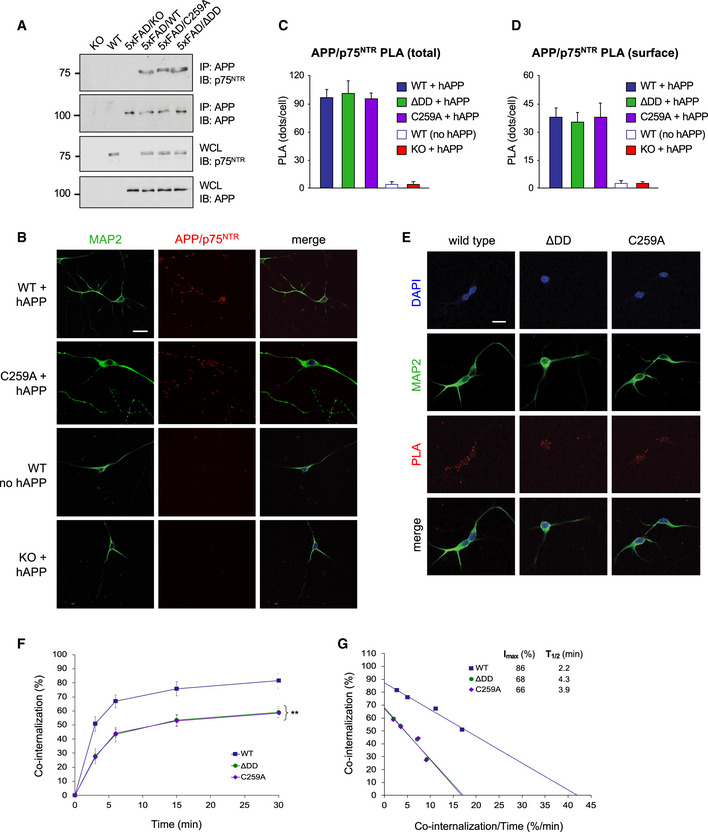
Figure 7. 5xFAD hAPP and p75NTR interact and co‐internalize in hippocampal neurons.

- Co‐immunoprecipitation between hAPP and p75NTR in hippocampal extracts from 6‐month‐old 5xFAD and p75NTR mutant mice as indicated. Results shown are representative from 3 independent experiments. Molecular weights are indicated in kDa. IP: immunoprecipitation; IB: immunoblotting; WCL, whole cell lysate.
- Proximity ligation assay (PLA) between triple mutant hAPP and p75NTR in hippocampal neurons from wild type and C259A mice (first and second rows, respectively). The third row (no APP) shows control PLA reaction in neurons that did not receive hAPP lentivirus. The fourth row (KO) shows control PLA reaction in neurons from p75NTR knock‐out mice infected with hAPP lentivirus. Counterstaining for MAP2 is also shown. Scale bar, 10 μm.
- Quantification of total PLA signals in wild type and p75NTR mutant neurons in the presence or absence of hAPP lentivirus, as indicated. Values were normalized to levels in wild‐type neurons and are expressed as mean PLA puncta per cell ± SEM from at least 25 neurons in 3 independent experiments.
- Quantification of cell surface PLA signals in wild type and p75NTR mutant neurons in the presence or absence of triple mutant hAPP lentivirus, as indicated. Live neuron cultures were fed with anti‐mouse p75NTR and anti‐hAPP antibodies on ice, washed after staining, fixed, and developed with PLA reaction. Values were normalized to levels in wild‐type neurons and are expressed as mean PLA puncta per cell ± SEM from at least 25 neurons in 3 independent experiments.
- Internalization of hAPP/p75NTR PLA signals in hippocampal neurons of wild type and p75NTR mutant mice. Live neuron cultures were fed with anti‐mouse p75NTR and anti‐hAPP antibodies on ice, washed, and plates placed at 37°C for different periods of time to allow internalization. Internalization was stopped by acid wash, followed by fixation and PLA reaction. Counterstaining for MAP2 and DAPI is also shown. Scale bar, 10 μm.
- Kinetics of co‐internalization of hAPP and p75NTR in hippocampal neurons from wild type, ΔDD, and C259A mice. Shown is mean ± SEM of percentage internalization of total surface PLA signal (set to 100%). N = 3 independent experiments each performed in duplicate; **P < 0.01 knock‐in mutants versus WT (2‐way ANOVA).
- Linear transformation of p75NTR internalization kinetics shown in (D).
Source data are available online for this figure.
