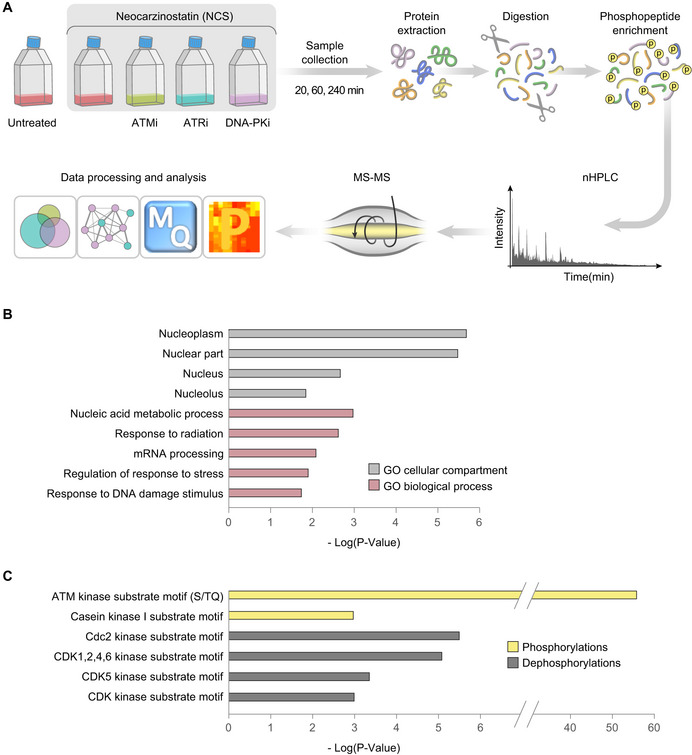
Schematic workflow of the phosphoproteomic experiment. Cells were treated with 20 ng/ml NCS in the presence of selective inhibitors of ATM (KU60019, 5 µM), ATR (AZ20, 0.5 µM), DNA‐PK (NU7441, 5 µM), or DMSO (inhibitor solvent). Inhibitors were added 30 min prior to NCS treatment, and samples were collected 20, 60, and 240 min following NCS addition. Protein extracts were digested into peptides and subsequently enriched for phosphopeptides, which were measured using LC‐MS/MS and subjected to label‐free quantification and subsequent data processing and analysis using the MaxQuant (Cox & Mann,
2008; Tyanova
et al,
2016a) and the Perseus (Tyanova
et al,
2016b) software. An FDR of 0.05 together with a minimal fold change of twofold was applied to determine regulation in response to NCS and PIKK inhibitors.

