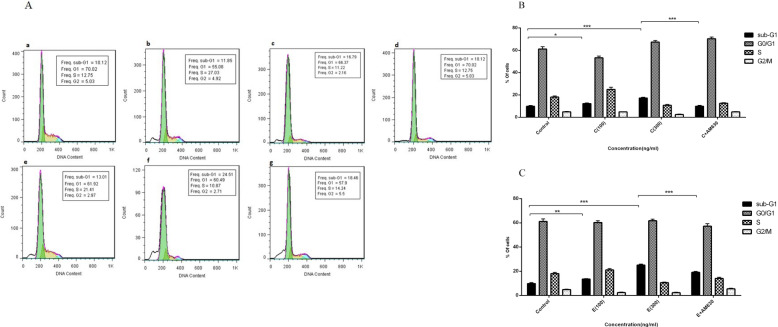
Fig. 4.
The effects of EP and CS extracts on cell cycle distribution in human lung cancer cells. The 100 and 300 ng/mL of EP and CS extracts were exposed to A549 cells for 36 h and cell cycle distribution was analyzed by flow cytometry using PI staining. A: represents the flow cytometry histograms indicating the un-treated cells (a), cells treated with 100 ng/mL of CS (b), 300 ng/mL of CS (c), 300 ng/mL of CS + 50 ng/mL of AM630 (d), cells treated with 100 ng/mL of EP (e), 300 ng/mL of EP (f), 300 ng/mL of EP + 50 ng/mL of AM630 (g) B: represents percentages of cells at the different phases of cell cycle following CS treatment. C: represents percentages of cells at the different phases of cell cycle following EP treatment. Data represent mean ± SD of three separate experiments. The statistical differences between treated and untreated groups were analyzed by ANOVA and are indicated by asterisks (* = P < 0.05, ** = P < 0.01, *** = P < 0.001)

