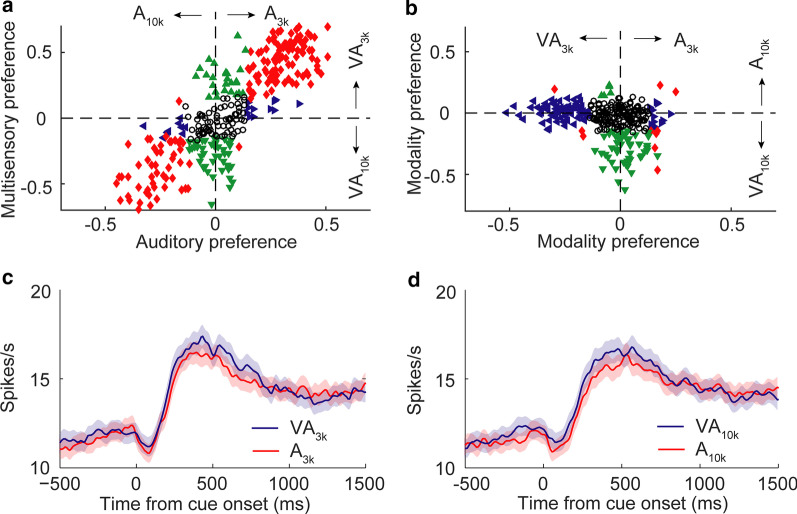
Fig. 4.
Distributions of neuronal choice preferences and mean responses. a Choice preferences (ROC value) for both auditory and multisensory responses are shown. Each symbol shows the value of a single neuron. Abscissa, auditory choice preference for A10k vs. A3k trials; ordinate, multisensory choice preference for VA10k vs. VA3k trials. Open circles: neither auditory nor multisensory choice preference was significant (p < 0.05, permutation test, 5000 iterations); triangles: either multisensory (green) or auditory (blue) choice preference was significant; red diamonds: both multisensory and auditory choice preferences were significant. Similarly, in b modality choice preference (auditory vs. multisensory) are shown. Dashed lines represent zero ROC values. c, d PSTHs show mean responses across populations for different stimulus trials. Shaded areas, SEM

