Fig. 5.
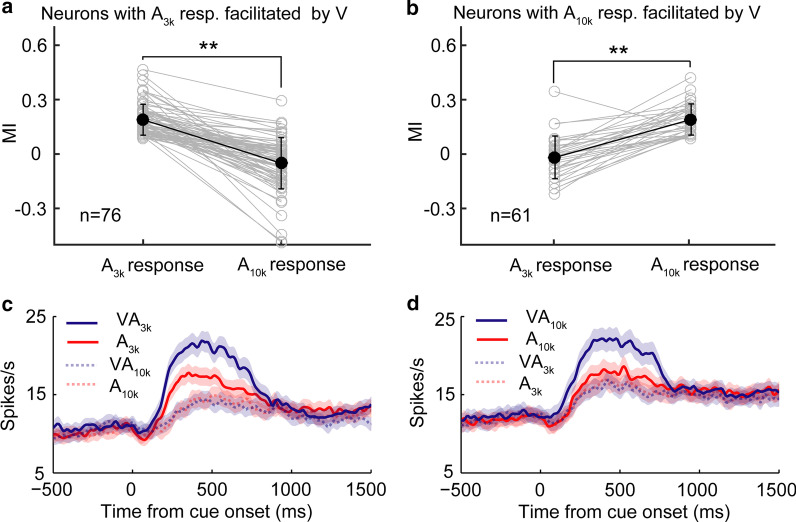
mPFC neurons exhibit a differential pattern of cross-modal interaction. a The comparison of the index of cross-modal interaction (MI) between low (3 kHz) and high (10 kHz) tone conditions for neurons with showing cross-modal facilitation in VA3k condition. MI is calculated by the following function: MI = (RVA—RA) / (RVA + RA); where RVA and RA represent the mean response in multisensory and auditory alone trials, respectively. Paired gray circles connected with a gray line represent one neuron’s responses. Dark circles represent the mean MI across neurons. **, p < 0.001. Similarly, b shows MI comparisons for neurons with showing cross-modal facilitation in VA10k condition. c, d shows the mean PSTHs of different cue trials for the same two groups of neurons shown in a and b, demonstrating greater responsiveness in the multisensory stimulation containing the preferred auditory stimulus

