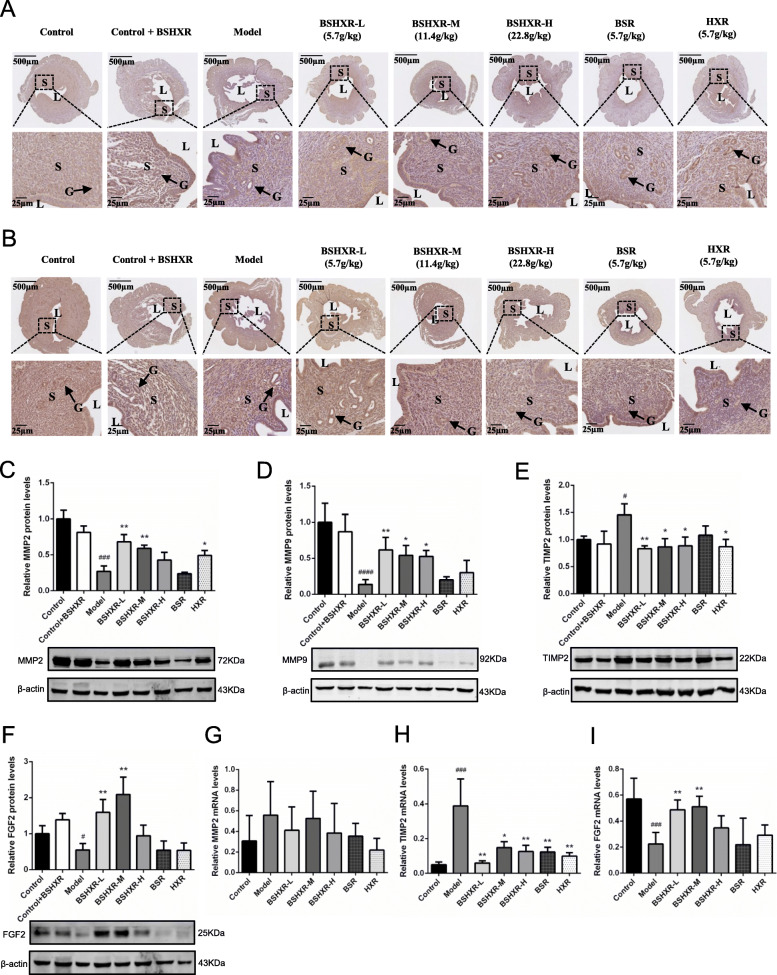
Fig. 5.
Effects of BSHXR on endometrial MMP2, MMP9, TIMP2, TIMP3, and FGF2 expression on ED4 midnight. a Representative images of MMP2 immunohistochemistry staining in the uterus. b Representative images of MMP9 immunohistochemistry staining in the uterus. c MMP2 protein level in endometrium (n = 3). d MMP9 protein level in endometrium (n = 3). e TIMP2 protein level in endometrium (n = 3). f FGF2 protein level in endometrium (n = 3). g Relative endometrial MMP2 mRNA level (n = 6). h Relative endometrial TIMP2 mRNA level (n = 5–7). i Relative endometrial FGF2 mRNA level (n = 5–6). The western blot images in (c), (d), (e), and (f) were cropped. Scale bar is shown in pictures. L, lumen; S, stroma. Arrows indicate the gland (G). Data were represented as mean ± SD. β-actin was the reference. #P < 0.05, ###P < 0.001, ####P < 0.0001 vs. control group, *P < 0.05, **P < 0.01 vs. model group

