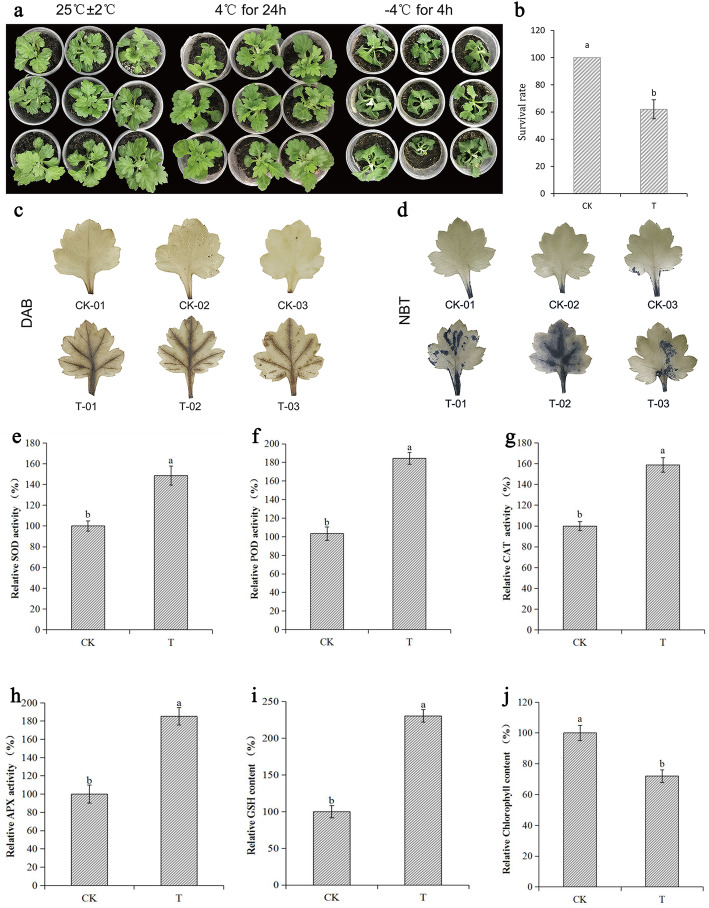
Fig. 1.
The phenotype, survival rate, and ROS content of chrysanthemum under low-temperature stress. T refers to chrysanthemums treated first at 4 °C for 24 h and then − 4 °C for 4 h, while CK is chrysanthemum without low-temperature treatment. The value measured without low-temperature treatment is taken as 1, and the relative content refers to the ratio between the low-temperature treatment and the untreated. a The phenotypic changes of chrysanthemum plants under low-temperature; (b) the survival rate of chrysanthemum under low-temperature; (c-d) histochemical staining with DAB and NBT for assessing the accumulation of H2O2 and O2−, respectively, under low-temperature. e Relative activity of SOD in chrysanthemum leaves before and after low-temperature treatment; (f) relative activity of POD in chrysanthemum leaves before and after low-temperature treatment; (g) relative activity of CAT in chrysanthemum leaves before and after low-temperature treatment; (h) relative activity of APX in chrysanthemum leaves before and after low-temperature treatment; (i) relative content of glutathione in chrysanthemum leaves before and after low-temperature treatment; (j) relative content of chlorophyll in chrysanthemum leaves before and after low-temperature treatment. Data represent means and standard errors of three replicates. Different letters above the columns indicate significant (P < 0.05) differences according to Duncan’s multiple range test

