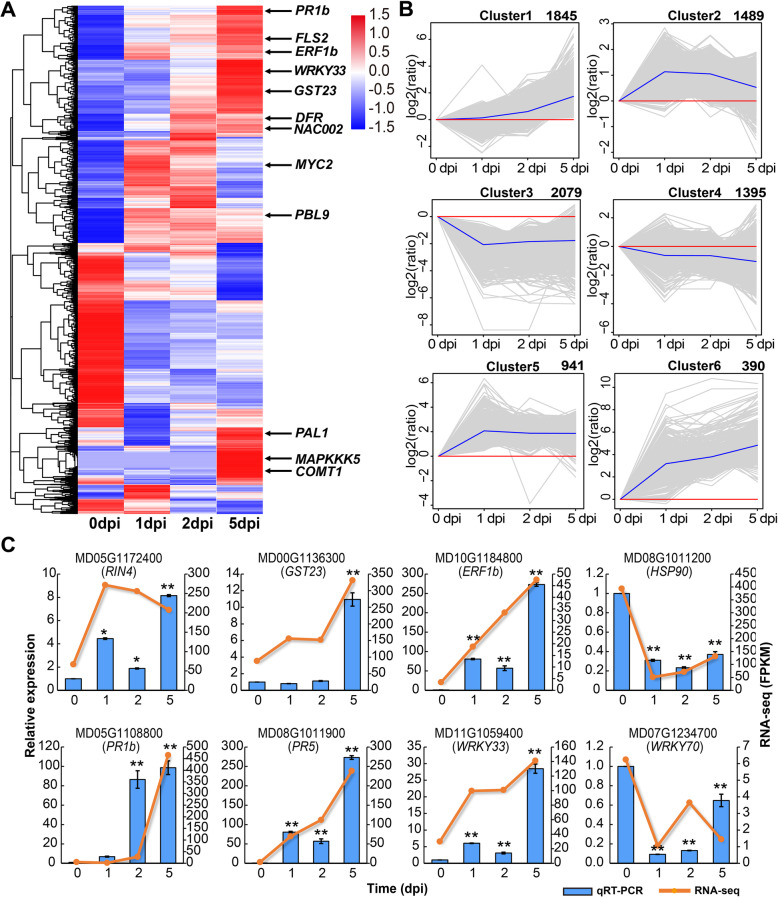
Fig. 5.
Clustering analysis of the DETs. a. Hierarchical clustering graph of 8139 DETs based on the averaged log10(FPKM+ 1) values of all genes in each cluster. b. 8139 DETs were clustered into six clusters by H-means clustering. The number of genes in each cluster is shown at the top of each cluster. Blue lines show the average values for relative expression levels in each cluster; gray lines represent the relative expression levels of each gene in each cluster; red lines represent the baselines. c. Expression pattern for the eight differentially expressed genes during the different disease response stages validated by qRT-PCR. RPM1-interacting protein 4 (RIN4), glutathione S-transferase 23 (GST23), ET-responsive transcription factor 1b (ERF1b), heat shock protein 90 (HSP90), pathogenesis-related protein 1b (PR1b), PR5, WRKY transcription factor 33 (WRKY33), WRKY transcription factor 70 (WRKY70). The normalized expression level (FPKM) of RNA-seq is indicated on the right y-axis and the relative expression of qRT-PCR is indicated on the right y-axis. qPCR quantitative gene expression data were shown as the mean ± SEM. Asterisks indicate significant differences (*p<0.05; **p<0.01; LSD’s test) between each infection timepoints and the 0-dpi control

