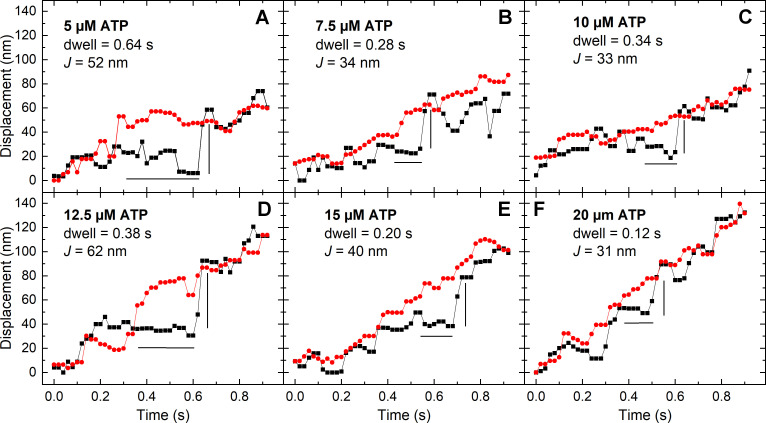
Figure 3.
Representative events showing dwell times followed by jumps at varying [ATP]. For all panels, the black squares and line are the displacement of the SpyC-605QD (RLC), and the red circles and line are the displacement of the SnoopC-705QD (LMM). The horizontal black line is the estimated time that the RLC trace pauses (dwell time) while the LMM traces rises, and the vertical black line is the jump distance (J). (A) 5 µM ATP. (B) 7.5 µM ATP. (C) 10 µM ATP. (D) 12.5 µM ATP. (E) 15 µM ATP. (F) 20 µM ATP.

