Figure 4.
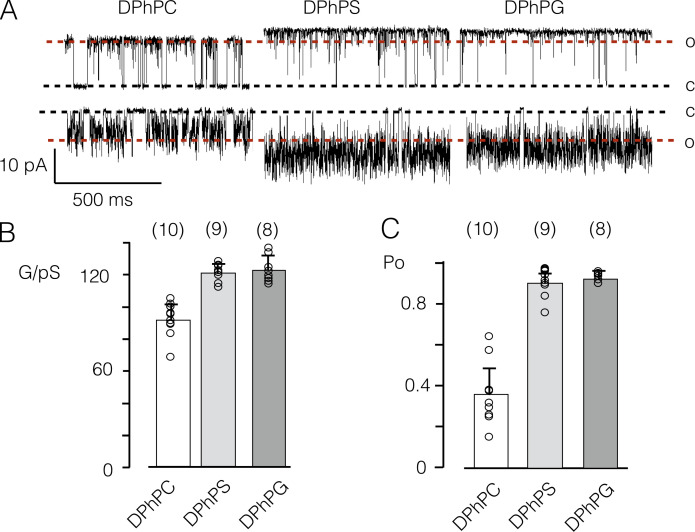
Impact of aPLs on KcvS function. (A) Representative channel fluctuations at +120 mV (top) and −120 mV (bottom) in DPhPC, DPhPS, or DPhPG bilayers. Closed (C) and open (O) levels are indicated. Dashed red lines mark the level of the open channel current in a DPhPC bilayer. (B and C) Mean conductance G (B) and mean open probability (C) of single-channel activity at +120 mV in the DPhPC, DPhPS, or DPhPG bilayer. Columns and error bars display means ± SD of number of independent measurements shown in brackets. The individual values are plotted as open black circles.

