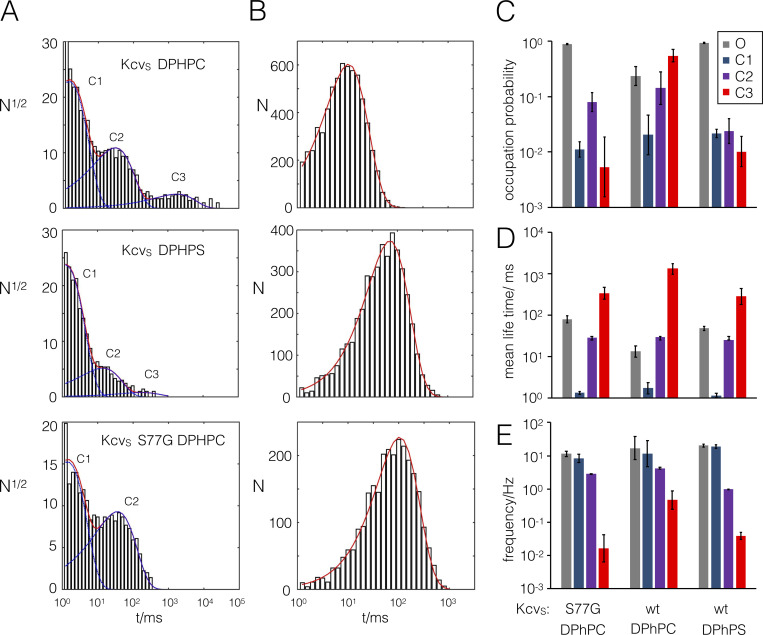
Figure 6.
Closed and open times of KcvS and KcvS S77G mutant in DPhPC and DPhPS bilayers. (A and B) Exemplary closed (A) and open (B) times at +120 mV from KcvS and Kcvs S77G in DPhPC and DPhPS bilayers as indicated. Closed time data can be fitted with three or two exponentials (blue lines) for states C1–C3. The sum of these exponentials is shown as a red line. The open dwell time is in all conditions described by a single exponential (red line). (C–E) The mean occupation probability (C), mean lifetime (D), and frequency of switching (E) into the respective states were extracted from data in A and B. The assignment of the columns in C–E to the open state O and closed states C1–C3 is shown in the inset. Data are geometric means ± geometric SD from n ≥ 3 independent experiments. wt, wild-type.

