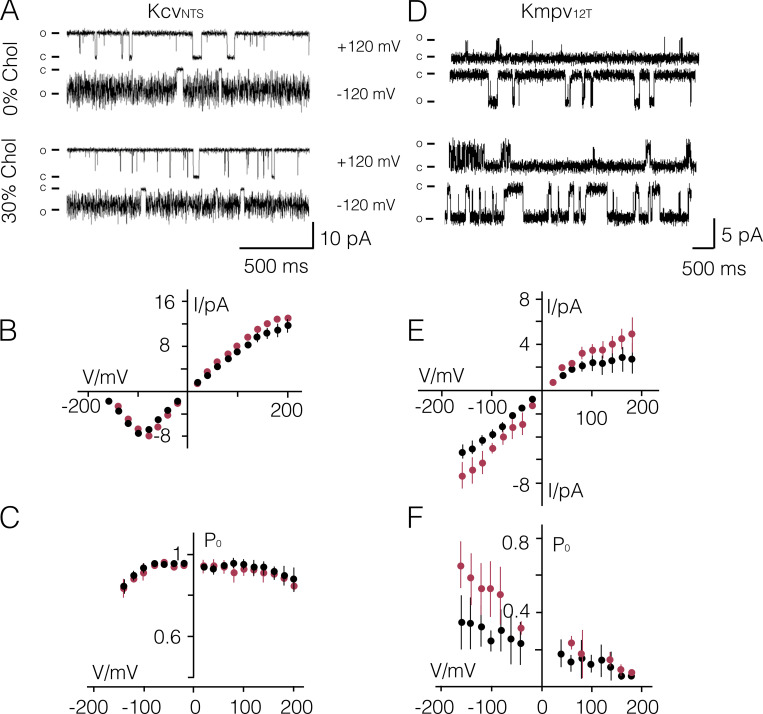
Figure S2.
Impact of cholesterol in phosphatidylcholine bilayers on KcvNTS and Kmpv12T function. (A–F) Representative fluctuations at ±120 mV in a pure DPhPC bilayer (0% Chol) and in DPhPC bilayer with 30 mol% cholesterol (30% Chol) from KcvNTS (A) and Kmpv12T (D). Closed (C) and open (O) levels are indicated. I/V relations (B and E) and PO/V relations (C and F) of the respective channels on top in absence (black) and presence (red) of 30 mol% Chol. Data are mean ± SD of n = 6/4 and n = 10/3 measurements with KcvNTS and Kmpv12T in the absence/presence of cholesterol, respectively. Chol, cholesterol.

