
Figure 1.
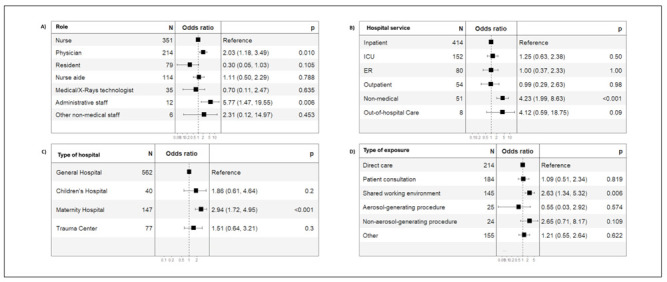
Risk of infection among healthcare workers role, hospital services, type of hospital and exposure.
Figure 1 shows the risks of COVID-19 infection according to hospital service (A), healthcare workers role (B), type of hospital (C), and type of exposure (D). Squares represent the observed proportions, and the lines extending from the squares are the 95% confidence intervals for these proportions. The confidence intervals that are reported as numbers to the right of the plot are 95% confidence intervals for the difference of proportions from the reference category. Reference categories are identified by the absence of 95% confidence intervals.