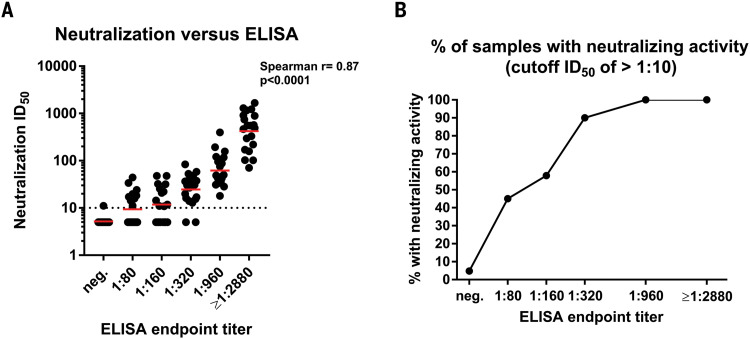
Fig. 2. Neutralizing activity of serum samples in relation to ELISA titers.
(A) A correlation analysis between ELISA titers on the x axis and neutralization titers in a microneutralization assay on the y axis. The Spearman ρ was determined. Red bars indicate the geometric mean. (B) The proportion of sera that exert any neutralizing activity in each of the ELISA titer categories. Testing was performed once, using an FDA EUA ELISA in a CLIA laboratory, or twice, following a standardized neutralization protocol.

