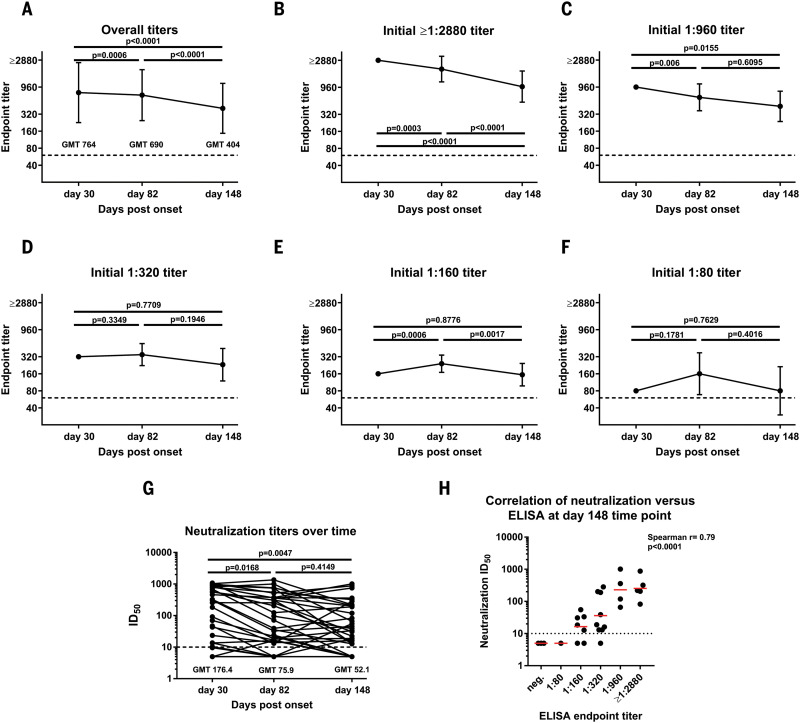
Fig. 3. Antibody titer stability over time.
(A) Titers of 121 volunteers whose blood was initially drawn ~30 days after COVID-19 symptom onset and who were then recalled for additional blood draws at ~82 days and 148 days after symptom onset. (B to F) The same data as in (A), but stratified by the initial (day 30) titer. Titers are graphed as geometric mean titers (GMT) with geometric standard error. (G) Neutralization titers of 36 individuals over time. A paired one-way analysis of variance corrected for multiple comparison was used to determine statistical significance. (H) A correlation analysis between ELISA titers on the x axis and neutralization titers in a microneutralization assay on the y axis at day 148. Red bars indicate the geometric mean. The Spearman ρ was determined. Testing was performed once, using an FDA EUA ELISA in a CLIA-certified laboratory, or twice, following a standardized neutralization protocol.

