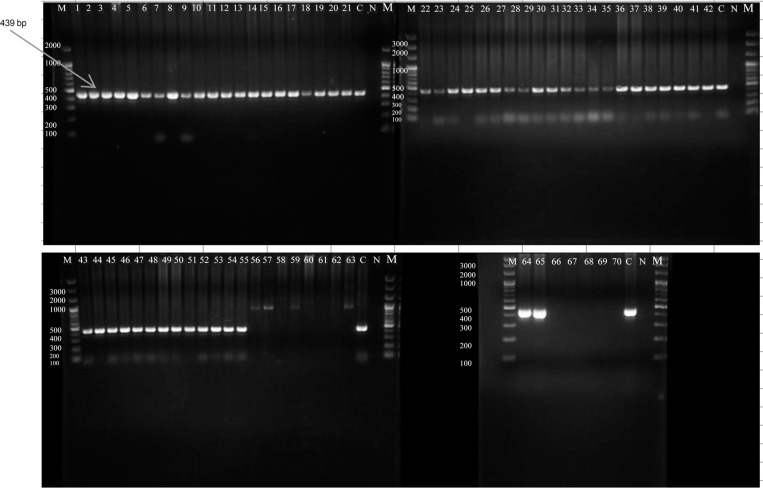
Fig. 1.
Agarose gel electrophoresis analysis for nested PCR products, using primers specific for E. histolytica, positive samples reveal 439 bp bands. Samples 1 to 55, 64,and 65 showed 439 bands; samples 56 to 63 and 66 to 70 tested negative for E. histolytica. Some of these negatives showed 900 bp bands, which are the product of the first PCR and an indicator for the presence of other Entamoeba species. C represented positive control, N represented negative control and M the 100 bp DNA marker.

