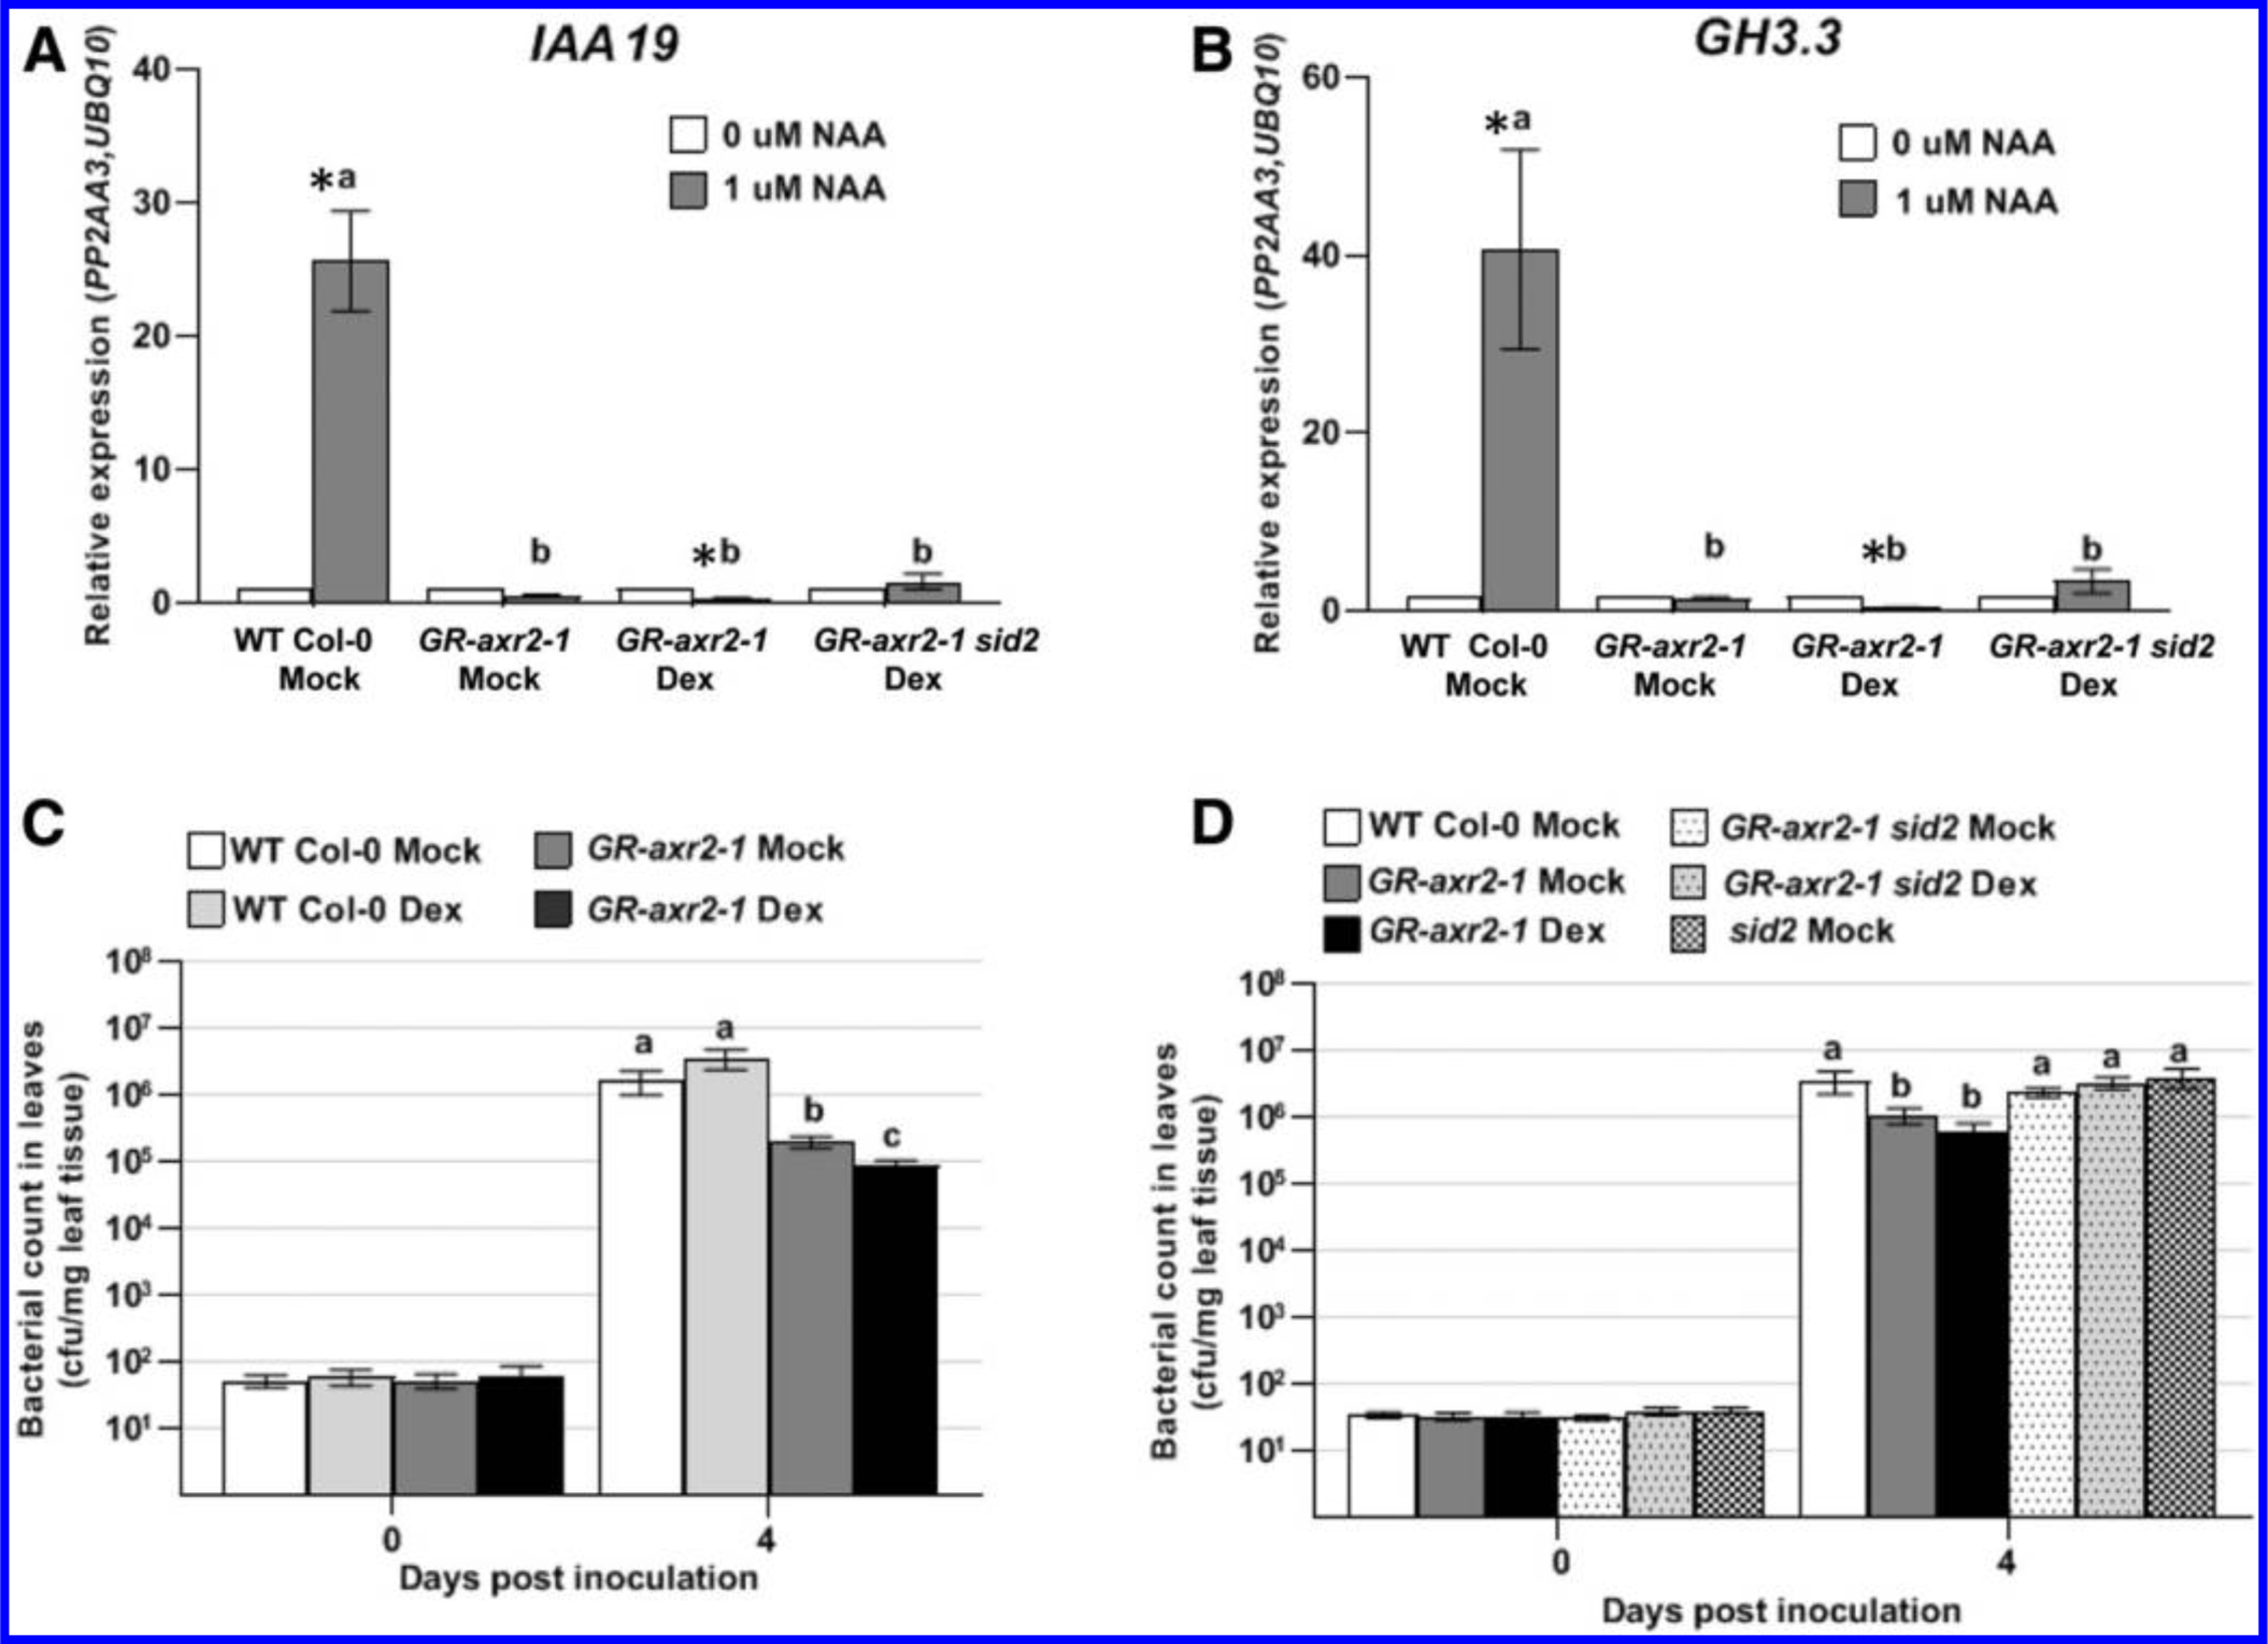
Fig. 1.

Expression of auxin-responsive genes IAA19 and GH3.3 and growth of PtoDC3000 in plants carrying the dominant axr2–1 mutation. A, Quantitative reverse transcription-PCR analysis of auxin-responsive gene expression IAA19 and B, GH3.3, 3 h after treatment with 1 μM naphthaleneacetic acid (NAA) or 0.01% dimethyl sulfoxide (0 μM NAA). Plants were pretreated with dexamethasone (Dex) or a buffer control (Mock) 24 h prior to NAA treatment. The expression data were normalized using PROTEIN PHOSPHATASE 2A SUBUNIT A3 (PP2AA3) and POLYUBIQUITIN 10 (UBQ10) as reference genes and the mock-treated sample was used as a calibrator of relative expression. Values are an average ± standard error of the mean (SEM) for data compiled from three independent experiments for Col-0 wild-type (WT) Mock (n = 9) and for two independent experiments for GR-axr2–1 and GR-axr2–1 sid2 (n = 6). Error bars are too small to see for several datapoints. C and D, Quantification of growth of PtoDC3000 in WT and GR-axr2–1 transgenic plants that were pretreated with Dex or a buffer control (Mock) 24 h prior to inoculation. In C, values are an average ± SEM for data from four independent experiments, carried out on different days, combined to generate composite growth curves, resulting in a total of 12 to 16 biological replicates for day 0 and 20 to 24 replicates for day 4. In D, values are an average ± SEM for data from three independent experiments, carried out on different days, combined to generate the composite growth curves, resulting in a total of 12 biological replicates for day 0 and 20 replicates for day 4. Statistical significance between plant genotypes determined by one-way analysis of variation, followed by a Tukey’s post hoc test. Samples indicated by different lower case letters are significantly different (P < 0.05). An asterisk (*) indicates significant difference between treatments (0 μM NAA vs. 1 μM NAA) with P < 0.05.
