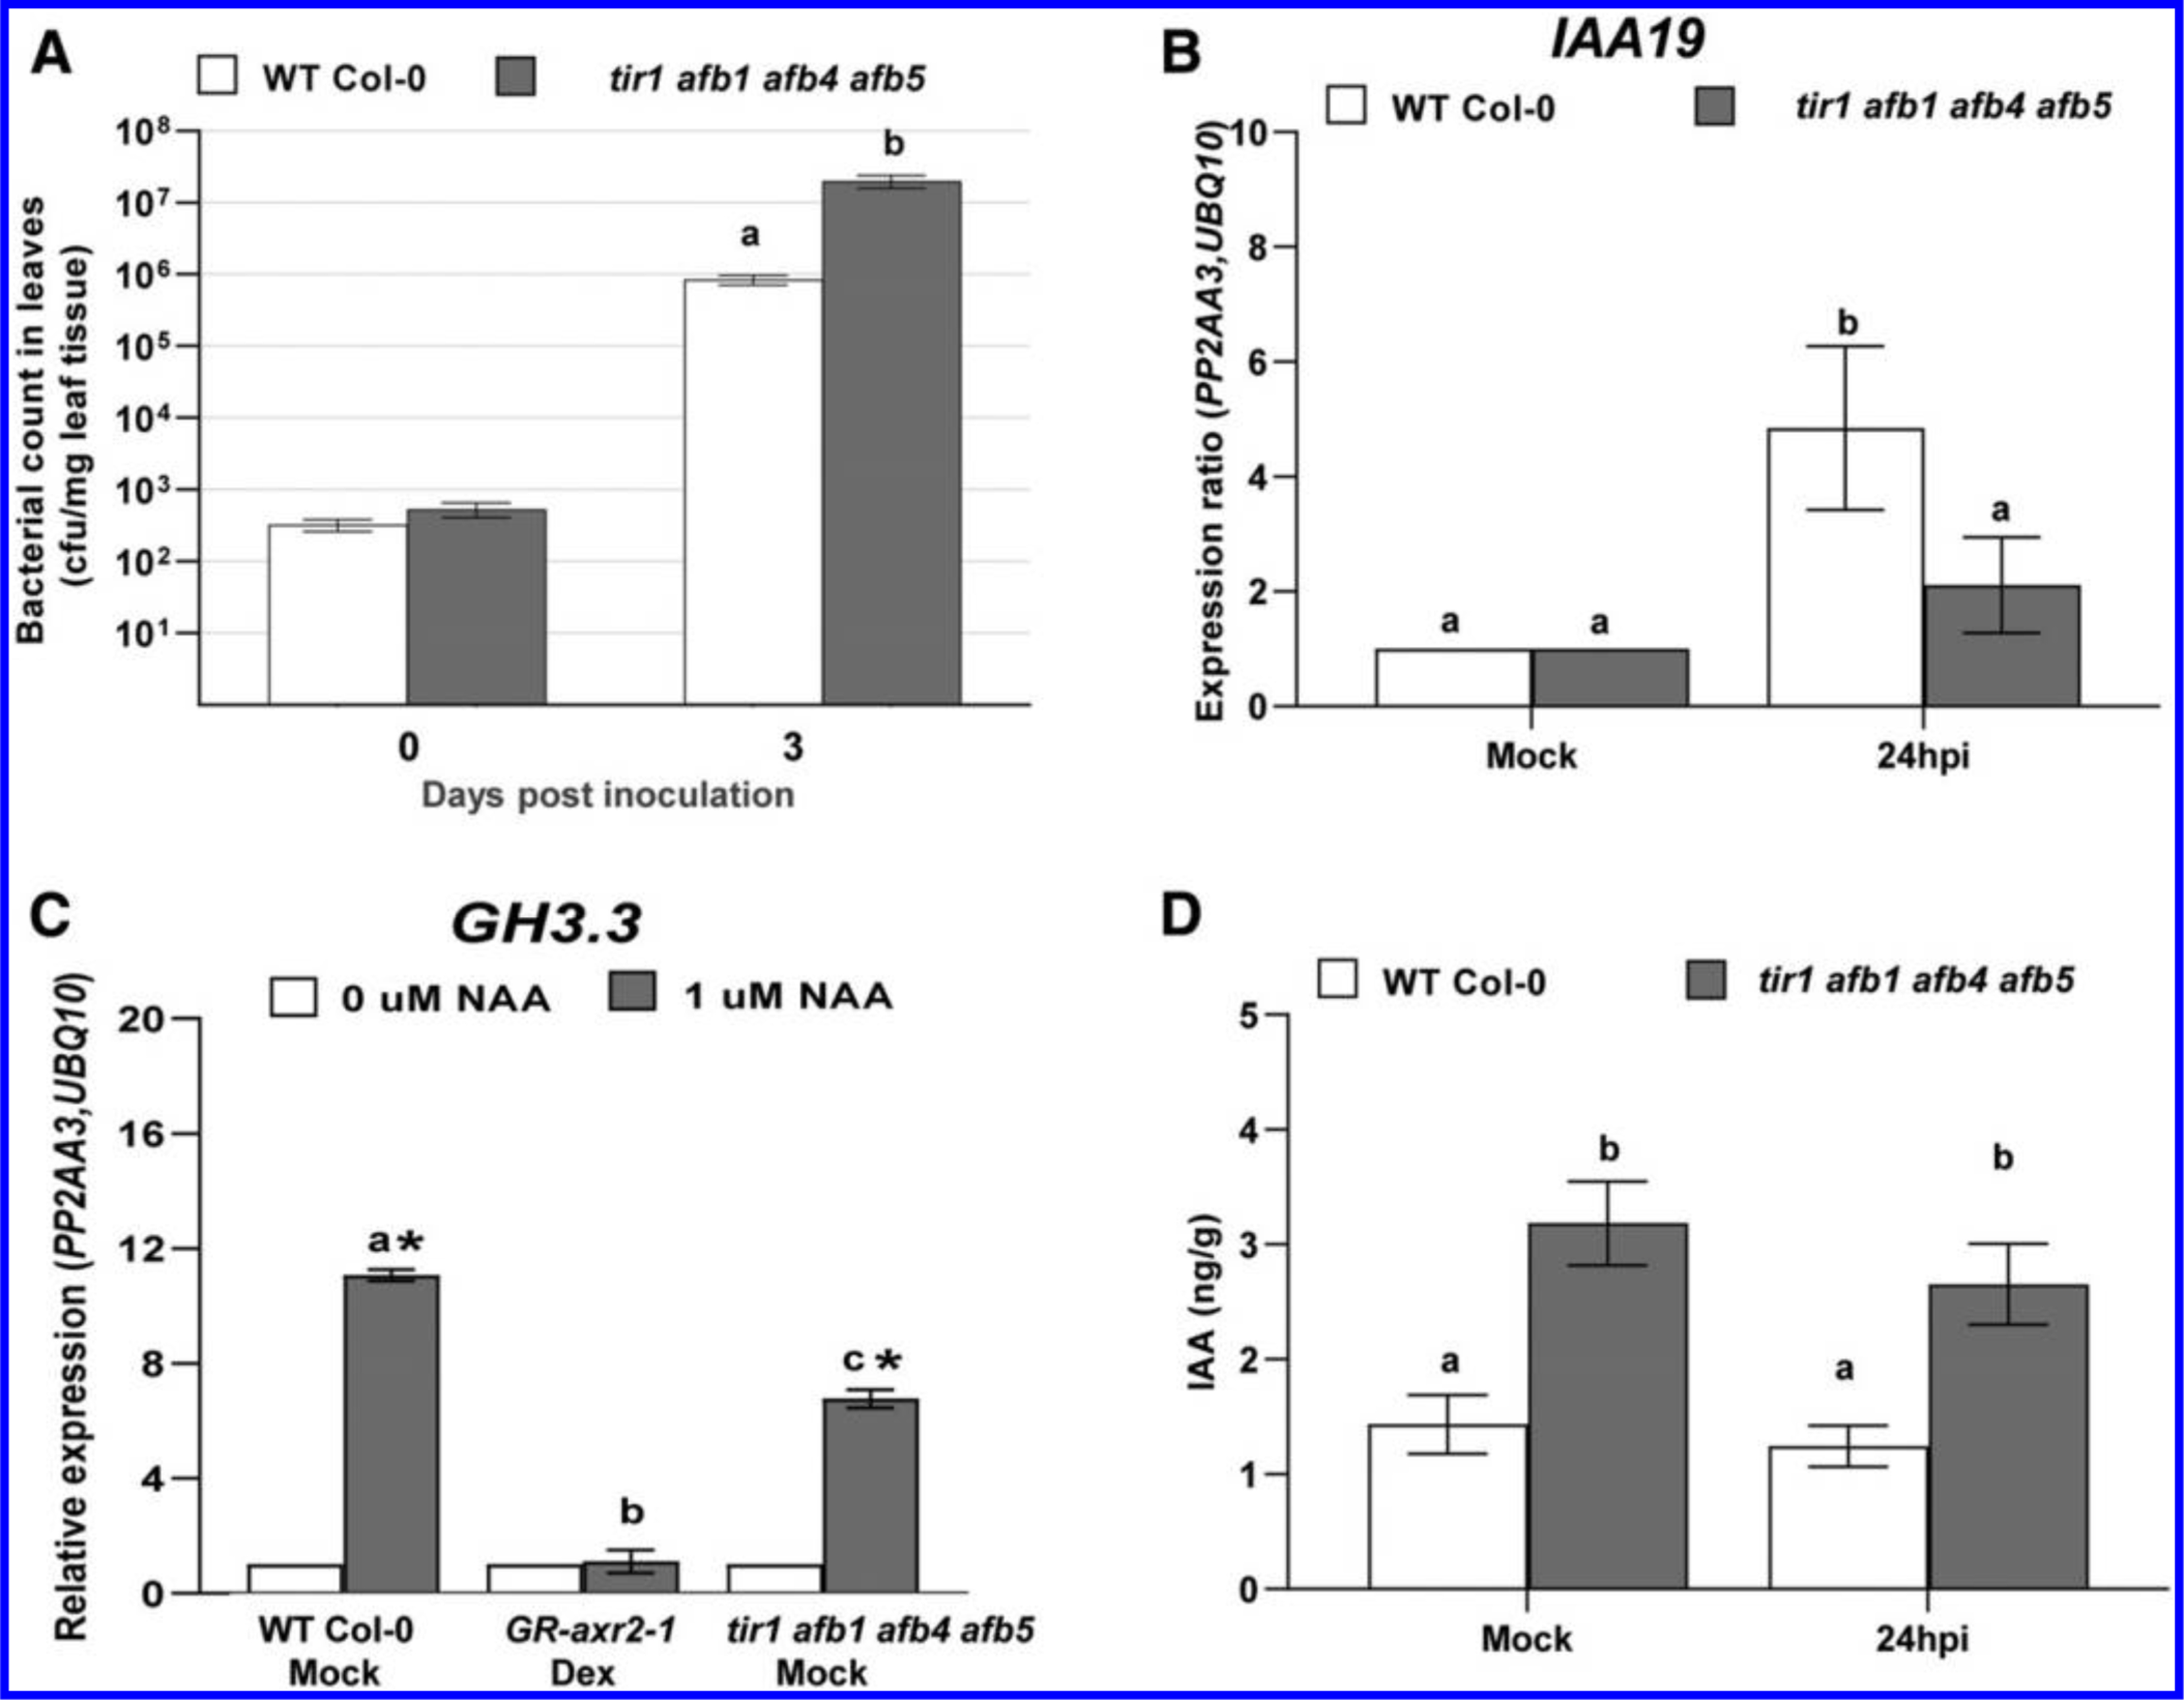
Fig. 2.

Growth of PtoDC3000, indole-3-acetic acid (IAA)-responsive gene expression, and quantification of IAA levels in auxin receptor mutants. A, Growth of PtoDC3000 in the tir1 afb1 afb4 afb5 mutant. Values are an average ± standard error of the mean (SEM) for data from four independent experiments, carried out on different days, combined to generate composite growth curves, resulting in a total of four to six biological replicates for day 0 and eight replicates for day 3. Statistical significance between plant genotypes was analyzed using the Student’s t test. B, Expression of the auxin-responsive gene IAA19 in wild type (WT) and tir1 afb1 afb4 afb5 mutant plants at 24 h after PtoDC3000 inoculation. Values are an average ± SEM for data compiled from two independent experiments with six biological replicates in total. C, Auxin-responsive GH3.3 gene expression in WT, GR-axr2–1, and tir1 afb1 afb4 afb5 mutant plants 3 h after treatment with 1 μM naphthaleneacetic acid (NAA) or 0.01% dimethyl sulfoxide (0 μM NAA). Plants were pretreated with dexamethasone (Dex) or a buffer control (Mock) 24 h prior to NAA treatment. Values are an average ± SEM for three biological replicates for Col-0 WT Mock, GR-axr2–1, and tir1 afb1 afb4 afb5. An asterisk (*) indicates significant difference between treatment (0 and 1 μM NAA) with P < 0.05. Similar results were observed for tir1 afb1 afb4 afb5 in a second independent experiment. For B and C, the expression data were normalized using PROTEIN PHOSPHATASE 2A SUBUNIT A3 (PP2AA3) and POLYUBIQUITIN 10 (UBQ10) and the mock-treated sample was used as a calibrator of relative expression. D, Free IAA levels in WT Col-0 and tir1 afb1 afb4 afb5 mutant plants, 24 h after Mock treatment (10 mM MgCl2) or inoculation with PtoDC3000. Values are an average ± SEM for data compiled from two independent experiments with six biological replicates in total. Results were analyzed using one-way analysis of variation, followed by a Tukey’s post hoc test. Similar results were obtained in a third independent experiment. Samples indicated by different lower case letters are significantly different (P < 0.05).
