Fig. 1.

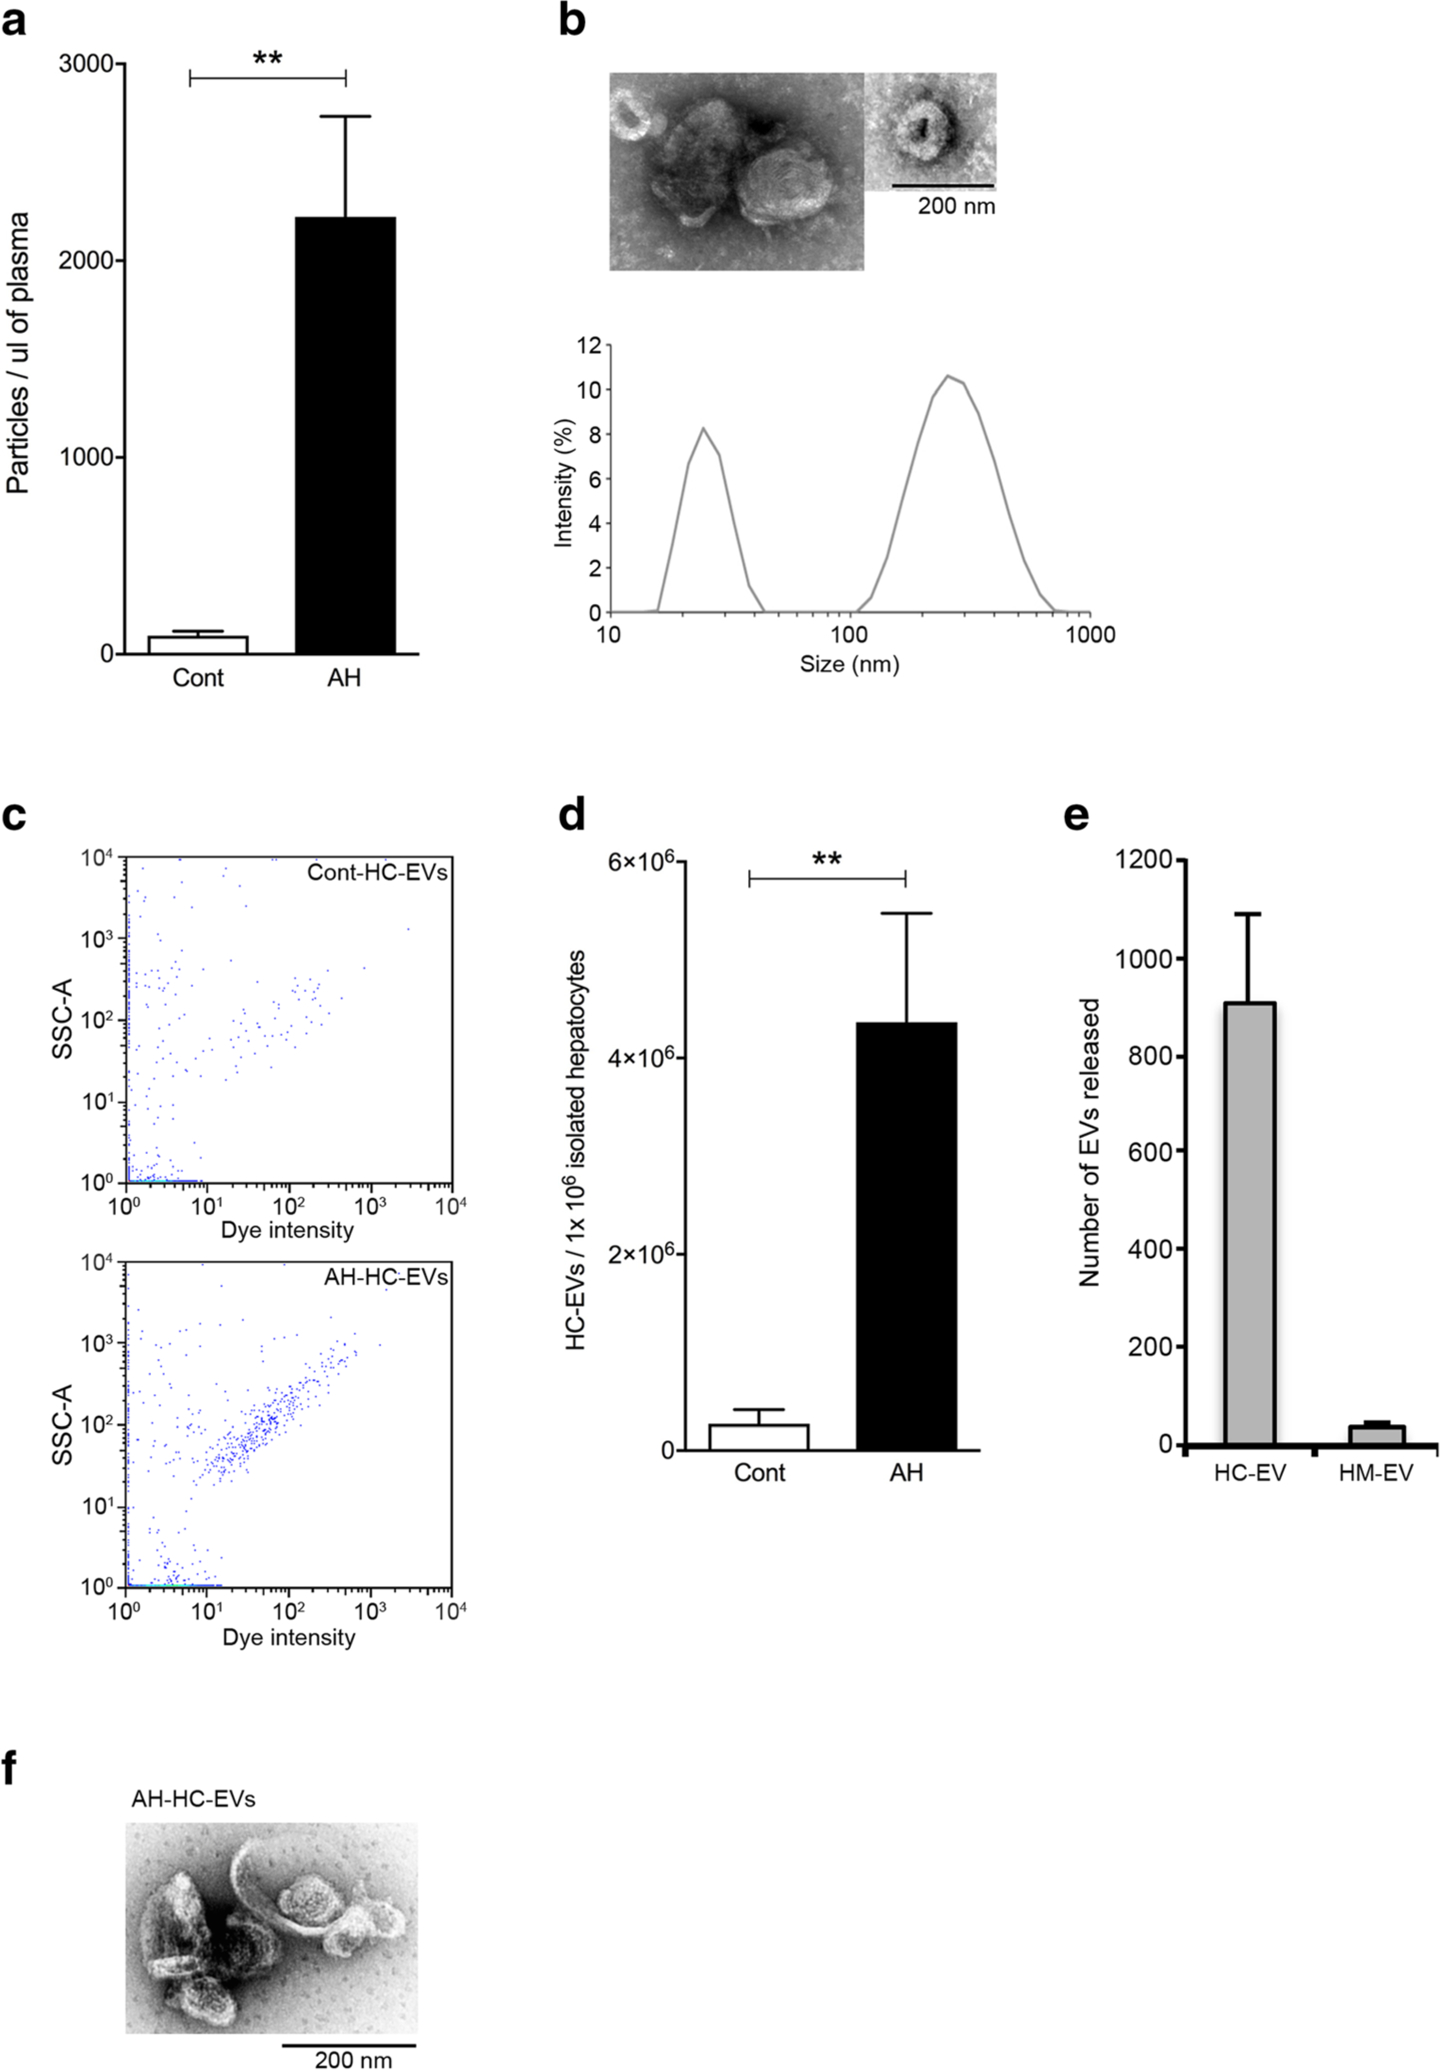
Circulating EVs and HC-EVs are increased in AH mice. a Quantification of stained circulating EVs via flow cytometry in pair-fed control or AH mice at 8 weeks plus weekly binge. **P < 0.01. b Dynamic light scattering analysis and transmission electron microscopy of isolated circulating EVs from AH mice. c Flow cytometry analysis (dot plot) of calcein+ HC-EVs from pair-fed control or AH mice. d–e Quantification of stained (d) hepatocyte-derived EVs (HC-EVs) or (e) hepatic macrophage-derived EVs (HM-EVs) from pair-fed control or AH mice. **P < 0.01. f Transmission electron microscopy of isolated HC-EVs from AH mice. Values are mean ± SEM
