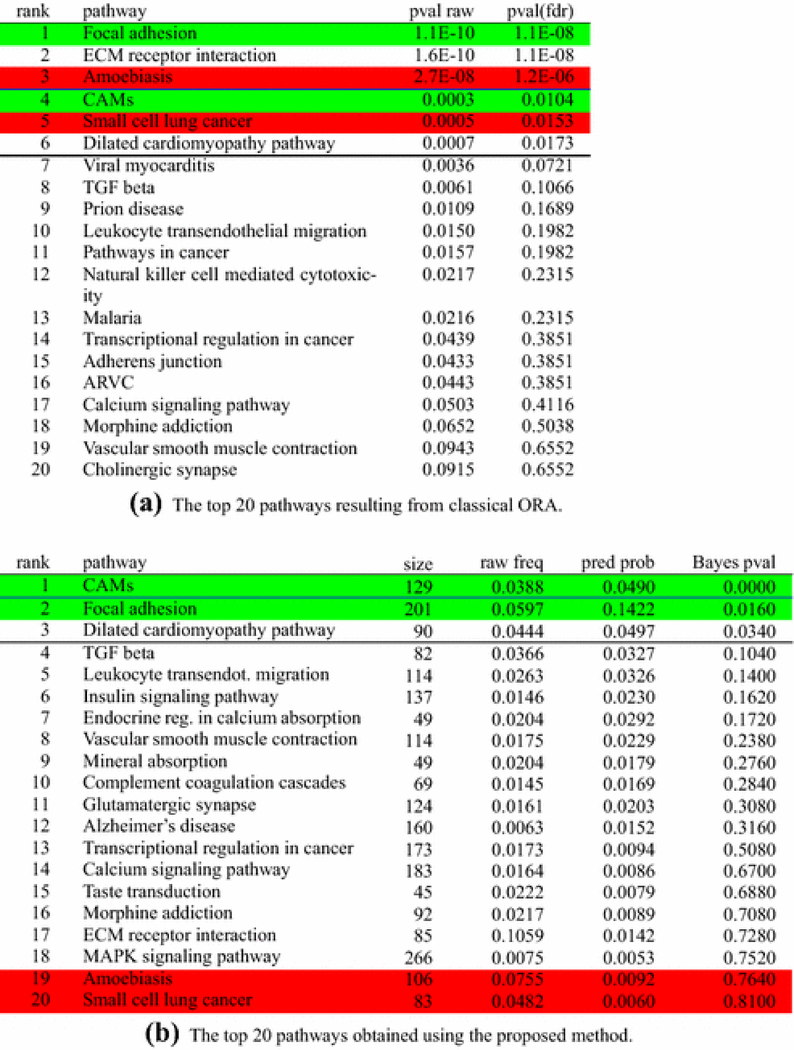
Fig. 3:
Analysis of the cervical ripening experiment. Ranking of pathways resulting from the proposed algorithm, sorted by their Bayes p-values. Only the top pathways are presented. The proposed algorithm gives the posterior mean of πj in the “pred prob” column and it is different from the “raw frequency” column which lists the proportion of DE genes for each pathway. The algorithm also calculates a “Bayes p-value” type of statistic that refers to the latent pathways and is different from the Fisher “p-value adjusted” calculated for the initial, non-latent pathways. Pathways highlighted in red represent pathways not related with the phenomenon in analysis, while pathways highlighted in green are those for which we know, with reasonable confidence, that they are involved in the given phenomenon. The white background indicates pathways for which we do not have conclusive information on their involvement (or lack of) with the phenomenon in analysis. The classical ORA reports 3 pathways as significant at 1%: one true positive, one false positive, and one for which the involvement with the phenomenon in analysis is unknown. When the threshold is 5%, one true positive, one false positive, and one pathway with unknown involvement are added to the list of significant pathways. The proposed approach reports a single pathway as significant at 1%, the Cell Adhesion Molecules, which is involved in the phenomenon of cervical ripening. Two other pathways are added at 5%, one true positive and one unknown. Both false positives reported by ORA are now placed towards the bottom, with p-values higher than 0.76.

