. 2021 Jan 15;129(1):017007. doi: 10.1289/EHP7699

Figure 2.

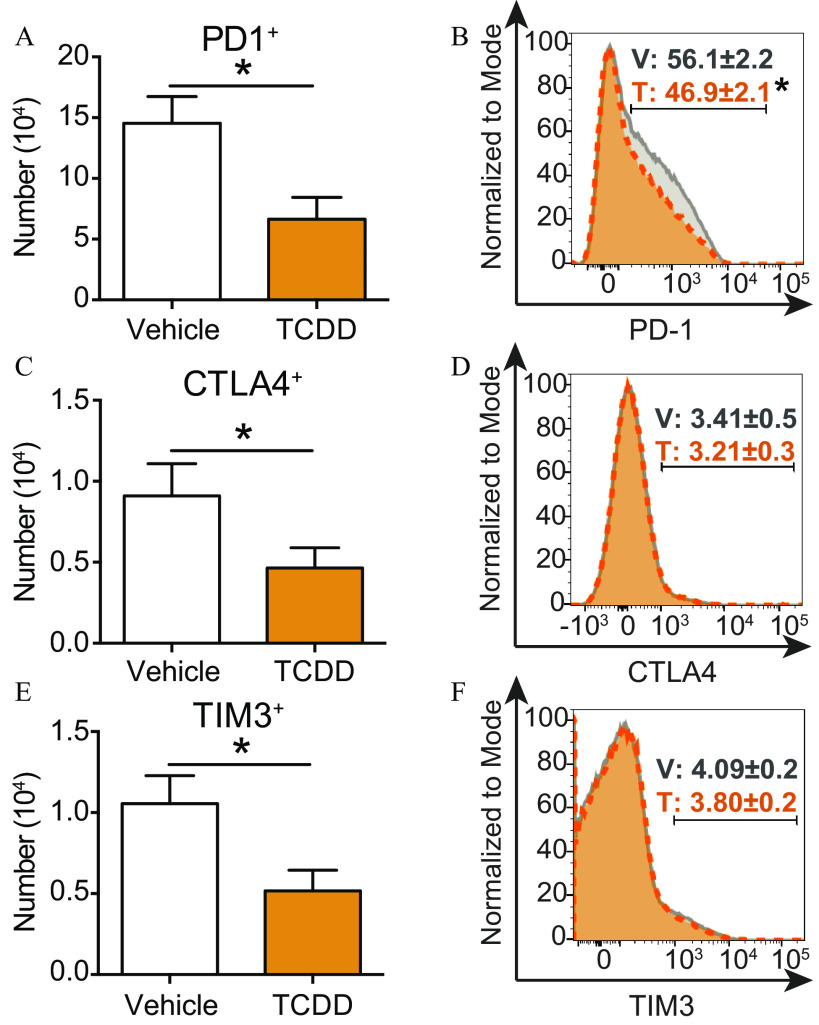
Figures 2A, 2C, and 2E are bar graphs plotting number (10 begin superscript 4 end superscript), ranging from 0 to 20 in increments of 5; 0.0 to 1.5 in increments of 0.5; and 0.0 to 1.5 in increments of 0.5 (y-axis) across vehicle and 2,3,7,8-tetrachlorodibenzo-p-dioxin (x-axis) for programmed cell death protein 1 positive, cytotoxic T-lymphocyte-associated protein 4 positive, and T cell immunoglobulin and mucin domain-containing protein 3 positive, respectively. Figures 2B, 2D, and 2F are area charts plotting normalized to mode, ranging from 0 to 100 in increments of 20 (y-axis) across programmed cell death protein 1, ranging 0, 10 begin superscript 3 end superscript, 10 begin superscript 4 end superscript, and 10 begin superscript 5 end superscript; cytotoxic T-lymphocyte-associated protein 4, ranging from negative 10 begin superscript 3 end superscript, 0, 10 begin superscript 3 end superscript, 10 begin superscript 4 end superscript, and 10 begin superscript 5 end superscript; and T cell immunoglobulin and mucin domain-containing protein 3, ranging from 0, 10 begin superscript 3 end superscript, 10 begin superscript 4 end superscript, and 10 begin superscript 5 end superscript (x-axis) for vehicle: 56.1 plus or minus 2.2; 3.41 plus or minus 0.5; 4.09 plus or minus 0.2 and 2,3,7,8-tetrachlorodibenzo-p-dioxin: 46.9 plus or minus 2.1; 3.21 plus or minus 0.3; and 3.80 plus or minus 0.2, respectively.

Exhaustion markers on CD4+ T cells during IAV infection following developmental AhR activation via maternal exposure to TCDD or vehicle. Vehicle (7 mice) or TCDD (8 mice) developmentally exposed mice were infected with IAV at maturity (6–8 wk of age). Nine days after infection, mice were euthanized and mediastinal lymph node cells stained for flow cytometry. (A,C,E) Bar graphs show the mean number of CD44hiCD4+ T cells from each exposure group that expressed (A) PD1, (C) CTLA4, or (E) TIM3. (B,D,F) Histograms depict the percentage of CD44hiCD4+ T cells from vehicle (gray solid line) or TCDD (orange dashed line) exposure groups that express (B) PD1, (D) CTLA4, or (F) TIM3. All values are mean±SEM. The numerical information, including p-values, are provided in Table S2. All offspring within a treatment group were from separate dams. *, p0.05, using Student’s t-test. Note: AhR, aryl hydrocarbon receptor; CTLA-4, cytotoxic T-lymphocyte-associated protein 4; IAV, influenza A virus; PD1, programmed cell death protein 1; SEM, standard error of the mean; T, TCDD; TCDD, 2,3,7,8-tetrachlorodibenzo-p-dioxin; TIM3, T-cell immunoglobulin and mucin domain-3; V, vehicle.