. 2021 Jan 15;129(1):017007. doi: 10.1289/EHP7699

Figure 3.

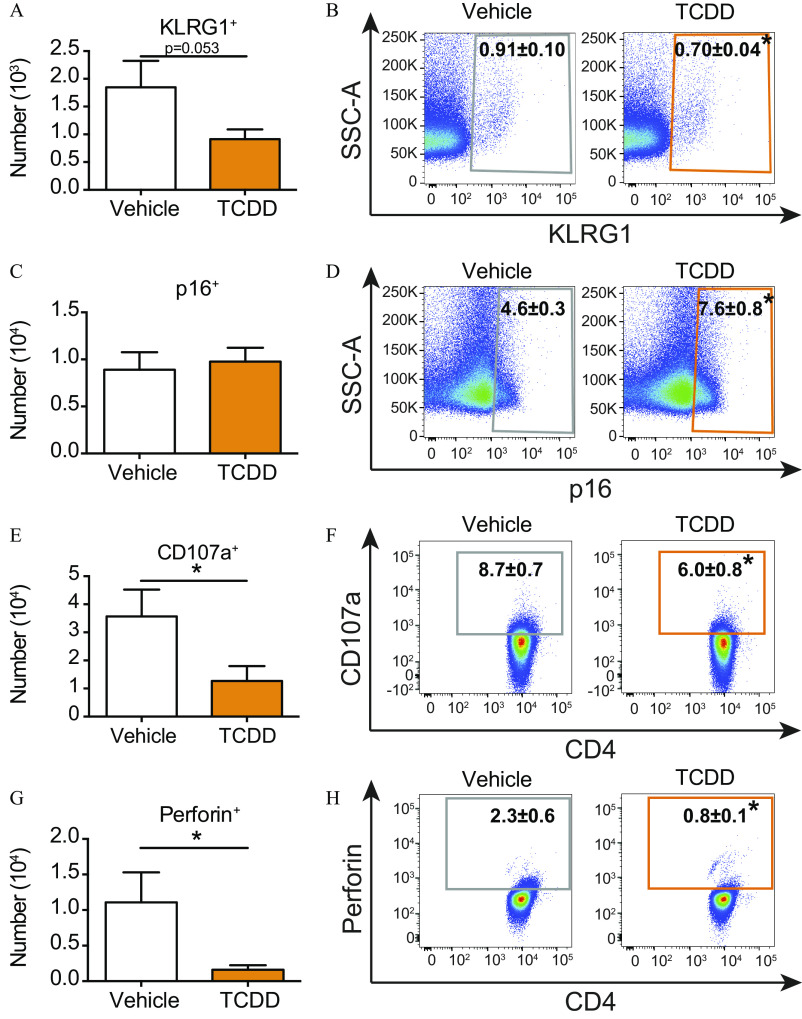
Figures 3A, 3C, 3E, and 3G are bar graphs plotting number (10 begin superscript 3 end superscript), ranging from 0.0 to 2.5 in increments of 0.5; number (10 begin superscript 4 end superscript), ranging from 0.0 to 1.5 in increments of 0.5; number (10 begin superscript 4 end superscript), ranging from 0 to 5 in unit increments; number (10 begin superscript 4 end superscript), ranging from 0.0 to 2.0 in increments of 0.5 (y-axis) across vehicle and 2,3,7,8-tetrachlorodibenzo-p-dioxin (x-axis) for Killer cell lectin-like receptor subfamily G member 1 positive, lowercase p equals 0.053; p16 positive; lysosomal-associated membrane protein-1 positive asterisk; and Perforin positive asterisk, respectively. Figure 3B is set of two scatter plot graphs plotting side scatter area, ranging from 0 to 250 thousand in increments of 50 thousand (y-axis) across Killer cell lectin-like receptor subfamily G member 1, ranging from 0, 10 begin superscript 2 end superscript, 10 begin superscript 3 end superscript, 10 begin superscript 4 end superscript, and 10 begin superscript 5 end superscript (x-axis) for vehicle: 0.91 plus or minus 0.10 and 2,3,7,8-tetrachlorodibenzo-p-dioxin: 0.7 plus or minus 0.04 asterisk. Figure 3D is a set of two scatter plot graphs plotting side scatter area, ranging from 0 to 250 thousand in increments of 50 thousand (y-axis) across p16, ranging from 0, 10 begin superscript 2 end superscript, 10 begin superscript 3 end superscript, 10 begin superscript 4 end superscript, and 10 begin superscript 5 end superscript (x-axis) for vehicle: 4.6 plus or minus 0.3 and 2,3,7,8-tetrachlorodibenzo-p-dioxin: 7.6 plus or minus 0.8 asterisk. Figure 3F is a set of two scatter plot graphs plotting lysosomal-associated membrane protein-1, ranging from negative 10 begin superscript 2 end superscript, 0, 10 begin superscript 2 end superscript, 10 begin superscript 3 end superscript, 10 begin superscript 4 end superscript, and 10 begin superscript 5 end superscript (y-axis) across cluster of differentiation 4 positive, ranging 0, 10 begin superscript 2 end superscript, 10 begin superscript 3 end superscript, 10 begin superscript 4 end superscript, and 10 begin superscript 5 end superscript (x-axis) for vehicle: 8.7 plus or minus 0.7 and 2,3,7,8-tetrachlorodibenzo-p-dioxin: 6.0 plus or minus 0.8 asterisk. Figure 3H is a set of two scatter plot graphs plotting Perforin, ranging from 0, 10 begin superscript 2 end superscript, 10 begin superscript 3 end superscript, 10 begin superscript 4 end superscript, and 10 begin superscript 5 end superscript (y-axis) across cluster of differentiation 4 positive, ranging 0, 10 begin superscript 2 end superscript, 10 begin superscript 3 end superscript, 10 begin superscript 4 end superscript, and 10 begin superscript 5 end superscript (x-axis) for vehicle: 2.3 plus or minus 0.6 and 2,3,7,8-tetrachlorodibenzo-p-dioxin: 0.8 plus or minus 0.1 asterisk.

Evaluation of senescence-associated characteristics of CD4+ T cells from the offspring of vehicle and TCDD-treated dams during IAV infection. Adult (6–8 wk of age) developmentally exposed mice were infected with IAV. Mediastinal lymph nodes (MLNs) were analyzed 9 d after infection. (A,C,E,G) The number of CD4+ T cells from vehicle (7 mice) or TCDD (8 mice for KLRG1 and p16; 3 mice for CD107a and perforin) developmentally exposed offspring that express (A) KLRG1, (C) p16, (E) CD107a, or (F) perforin are shown as bar graphs. (B,D,F,H) Scatter plots show the percentage of (B) p16+, (D) KLRG1+, (F) CD107a+, or (H) perforin+ CD4+ T cells from infected mice that were developmentally exposed to vehicle (left) or TCDD (right). The numerical information is provided in Table S2. All offspring within a group were from separate dams. Values are mean±SEM. *, p 0.05, using Student’s t-test. Note: CD107a, lysosomal-associated membrane protein 1; IAV, influenza A virus; KLRG1, killer cell lectin-like receptor subfamily G member 1; p16, cyclin-dependent kinase inhibitor 2A; SEM, standard error of the mean; SSC-A, side scatter area; TCDD, 2,3,7,8-tetrachlorodibenzo-p-dioxin.