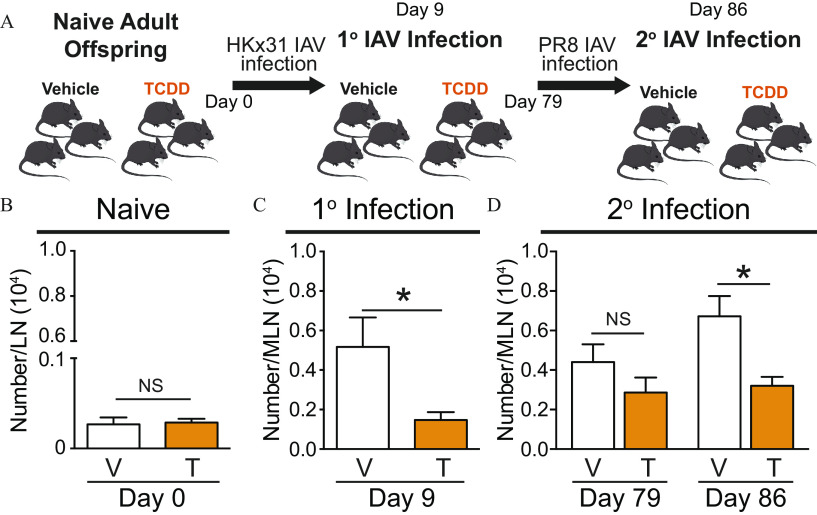
Figure 4.
Assessment of T cells from developmentally exposed mice during primary and recall responses to IAV. (A) Scheme of experimental set up. Mice were developmentally exposed to vehicle (V) or TCDD (T) and experiment was initiated when the offspring were 6–8 wk of age. (B) The number of virus-specific T cells in the lymph nodes of naïve mice (8 vehicle; 9 TCDD) was quantified using flow cytometry. (C,D) Offspring of vehicle-treated dams and offspring of TCDD-treated dams were challenged with HKx31 (primary infection). (C) On Day 9 post primary infection, the number of virus-specific T cells in 8 mice from the vehicle exposure group and 8 mice from the TCDD group was determined using flow cytometry. (D) Mice recovered from primary IAV infection for 79 d. The number of virus-specific T cells was quantified prior to (7 vehicle; 7 TCDD) and 7 d after PR8 infection (secondary infection; 8 vehicle; 9 TCDD). The mice were 17–19 wk of age at the time of the secondary infection. The mean number of cells and -values are provided in Table S3. At each point in time, offspring within the same exposure group were from separate dams. All values are . *, , using Student’s -test. Note: IAV, influenza A virus; LN, lymph node; MLN, mediastinal lymph node; SEM, standard error of the mean; TCDD, 2,3,7,8-tetrachlorodibenzo--dioxin; 1°, primary; 2°, secondary.

