. 2021 Jan 15;129(1):017007. doi: 10.1289/EHP7699

Figure 5.

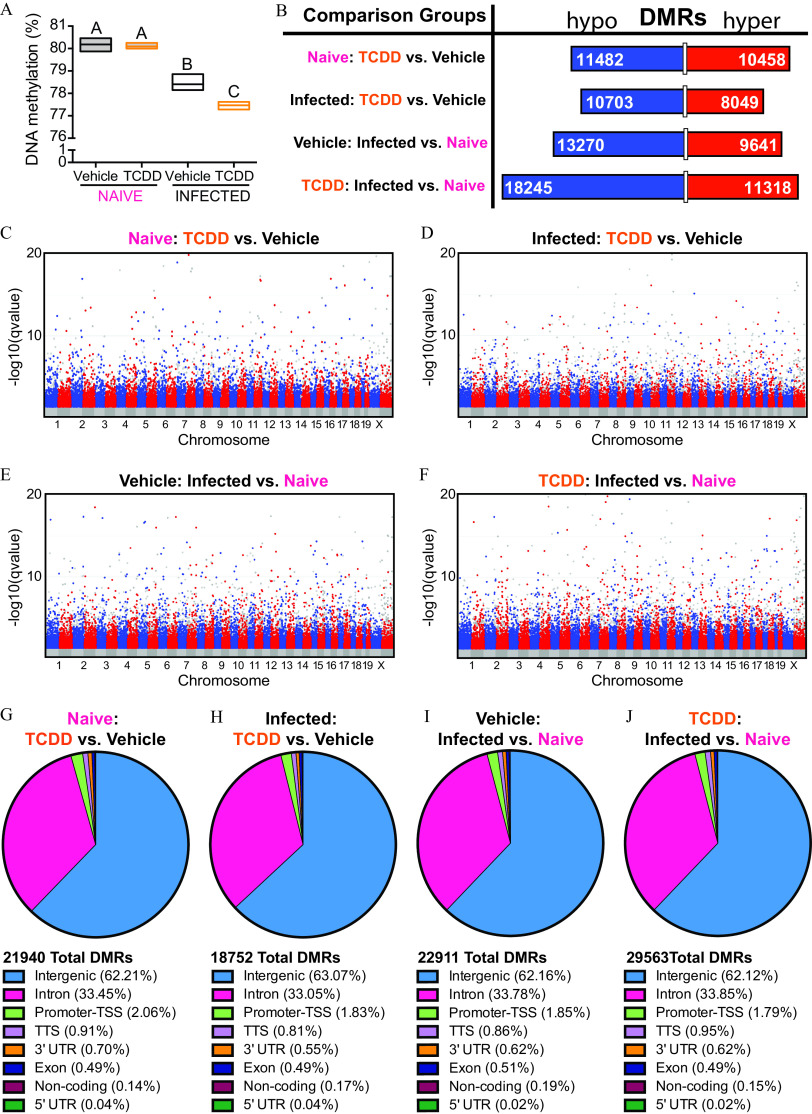
Figure 5A is an error bar graph plotting D N A methylation (percentage), ranging from 0 to 1 in unit increments and 76 to 81 in unit increments (y-axis) across naïve and infected for vehicle and 2,3,7,8-tetrachlorodibenzo-p-dioxin (x-axis) for A and A in Naïve and B and C in infected, respectively. Figure 5B is a horizontal stacked bar graph plotting comparison groups, including naïve: 2,3,7,8-tetrachlorodibenzo-p-dioxin versus vehicle; infected: 2,3,7,8-tetrachlorodibenzo-p-dioxin versus vehicle; vehicle: infected versus naïve; and 2,3,7,8-tetrachlorodibenzo-p-dioxin: infected versus naïve (y-axis) across differentially methylated regions, including hypo and hyper (x-axis). Figures 5C, 5D, 5E, and 5F are clustered bar graphs titled Naïve: 2,3,7,8-tetrachlorodibenzo-p-dioxin versus vehicle; Infected: 2,3,7,8-tetrachlorodibenzo-p-dioxin versus vehicle; Vehicle: infected versus naïve; and 2,3,7,8-Tetrachlorodibenzo-p-dioxin: infected versus naïve plotting negative log 10 of (lowercase q value), ranging from 10 to 20 in increments of 10 (y-axis) across chromosome, ranging from 1 to 19 in unit increments and uppercase x (x-axis). Figure 5G is a pie chart titled Naïve: 2,3,7,8-tetrachlorodibenzo-p-dioxin versus vehicle and is divided into eight parts representing 21,940 total differentially methylated regions. Intergenic is 62.21 percent, Intron is 33.45 percent, Promoter-transcription start site is 2.06 percent, Transcription start site is 0.91 percent, 3 prime Untranslated region is 0.70 percent, Exon is 0.49 percent, Non-coding is 0.14 percent, and 5 prime Untranslated region is 0.04 percent. Figure 5H is a pie chart titled Infected: 2,3,7,8-tetrachlorodibenzo-p-dioxin versus vehicle and is divided into eight parts representing 18,752 total differentially methylated regions. Intergenic is 63.07 percent, Intron is 33.05 percent, Promoter-transcription start site is 1.83 percent, Transcription start site is 0.81 percent, 3 prime Untranslated region is 0.55 percent, Exon is 0.49 percent, Non-coding is 0.17 percent, and 5 prime Untranslated region is 0.04 percent. Figure 5I is a pie chart titled Vehicle: infected versus naïve and is divided into eight parts representing 22,911 total differentially methylated regions. Intergenic is 62.16 percent, Intron is 33.78 percent, Promoter-transcription start site is 1.85 percent, Transcription start site is 0.86 percent, 3 prime Untranslated region is 0.62 percent, Exon is 0.51 percent, Non-coding is 0.19 percent, and 5 prime Untranslated region is 0.02 percent. Figure 5J is a pie chart titled 2,3,7,8-Tetrachlorodibenzo-p-dioxin: infected versus naïve and is divided into eight parts representing 29,563 total differentially methylated regions. Intergenic is 62.12 percent, Intron is 33.85 percent, Promoter-transcription start site is 1.79 percent, Transcription start site is 0.95 percent, 3 prime Untranslated region is 0.62 percent, Exon is 0.49 percent, Non-coding is 0.15 percent, and 5 prime Untranslated region is 0.02 percent.

DNA methylation patterns in CD4+ T cells from naïve IAV-infected mice that were developmentally exposed to TCDD or vehicle. Mice were developmentally exposed to vehicle or TCDD, as described in Figure 1. Whole-genome bisulfite sequencing was performed using DNA from purified CD4+ T cells from naïve or IAV-infected adult mice (8–10 wk of age). For naïve offspring, peripheral lymph nodes from 1 mouse were pooled, and there was a total of three replicates per treatment group, with 1 offspring from unique dams used per replicate, for a total of 6 mice. For IAV-infected offspring mediastinal lymph nodes were used. Mice were sacrificed 9 d after infection, and there were three replicates per treatment group, with 4–6 offspring in each unique pool of cells for a total of 30 total mice used. All of the mice were sacrificed at the same time. (A) Box plots show global DNA methylation levels. The horizontal line denotes the mean, and boxes depict SEM. Differences between groups were evaluated using a two-way ANOVA with Tukey’s HSD post hoc test, and p-values are reported in Table S4. Groups with the same letter were not significantly different from each other. (B) The number of differentially methylated regions (DMRs) that were hypo- (blue; left side) or hyper- (red; right side) methylated are shown. The length of the bar is proportionate to the number of DMRs, and the number of DMRs is denoted on the bar segments. (C–F) Modified Manhattan plots show the distribution of hypomethylated (blue dots; left cluster) and hypermethylated (red dots; right cluster) DMRs across chromosomes in CD4+ T cells. (C,D) DMRs in CD4+ T cells from naïve (C) or IAV-infected TCDD (D) mice compared with vehicle controls. (E,F) DMRs in CD4+ T cells from vehicle (E) or TCDD (F) mice during IAV infection compared with naïve controls. The direction of hyper- and hypomethylation in (B) top two comparisons, (C) and (D) refer to the effect of developmental exposure to TCDD, or refers to the effect of infection in (B) bottom two comparisons, (E) and (F). Global methylation levels were analyzed by ANOVA with a Tukey HSD post hoc test. (G–J) DMRs were mapped to the genome. The total numbers of DMRs are shown. The percent of DMRs in intergenic, intron, TSS, TTS, 3′UTR, exon, noncoding, and 5′UTR regions are shown. The following comparisons were made: (G) DMRs from CD4+ T cells from naïve TCDD vs. naïve vehicle mice, (H) DMRs from CD4+ T Cells from IAV-infected TCDD vs. IAV-infected vehicle mice, (I) DMRs from CD4+ T cells from vehicle IAV-infected vs. vehicle naïve mice, and (J) DMRs from CD4+ T cells from TCDD IAV-infected vs. TCDD naïve mice. Note: ANOVA, analysis of variance; HSD, honestly significant difference; IAV, influenza A virus; SEM, standard error of the mean; TCDD, 2,3,7,8-tetrachlorodibenzo-p-dioxin; TSS, transcription start site; TTS, transcription termination site; UTR, untranslated region.