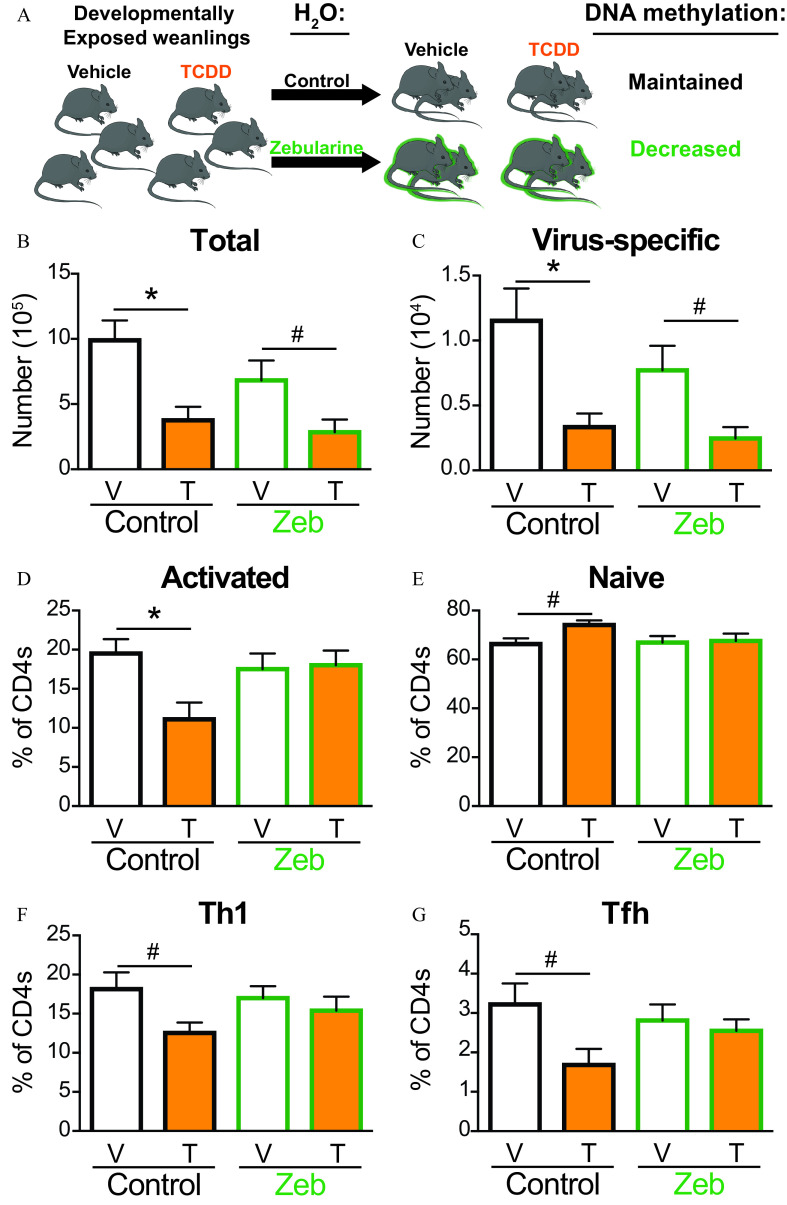
Figure 8.
Effects of Zebularine (Zeb) on T cells from developmentally exposed mice after infection with IAV. (A) Mice were developmentally exposed to vehicle or TCDD. At weaning (21 d of age), mice were randomly selected be given normal vivarium water to maintain DNA methylation levels or water containing Zeb () to decrease DNA methylation levels. At 6–8 wk of age, mice developmentally exposed to vehicle (white bar) and TCDD (orange bar) were infected with IAV. Mediastinal lymph nodes (MLNs) were harvested 9 d after infection, and cells stained for flow cytometry. (B) The number of T cells or (C) virus-specific T cells were quantified from MLNs of mice on control (black outline) or Zeb (green outline) water. The percentage of (D) activated () or (E) naïve () T cells from control or Zeb mice. The percentage of (F) Th1 () or (G) Tfh () isolated from control or Zeb mice. For each group, 5–9 developmentally exposed offspring were used: control water vehicle (8), control water TCDD (5), Zeb water vehicle (9), and Zeb water TCDD (6). Due to a limited number of offspring, individual offspring were defined as the statistical unit, rather than the dam. All data shown are . *, , using a two-way ANOVA with Tukey’s HSD and Student’s -test. #, , using Student’s -test. The numerical data in the graphs and -values are provided in Table S7. Note: ANOVA, analysis of variance; HSD, honestly significant difference; , water; IAV, influenza A virus; SEM, standard error of the mean; T, TCDD; Tbet, T-box transcription factor; TCDD, 2,3,7,8-tetrachlorodibenzo--dioxin; Tfh, T follicular helper; Th, T helper; V, vehicle.

