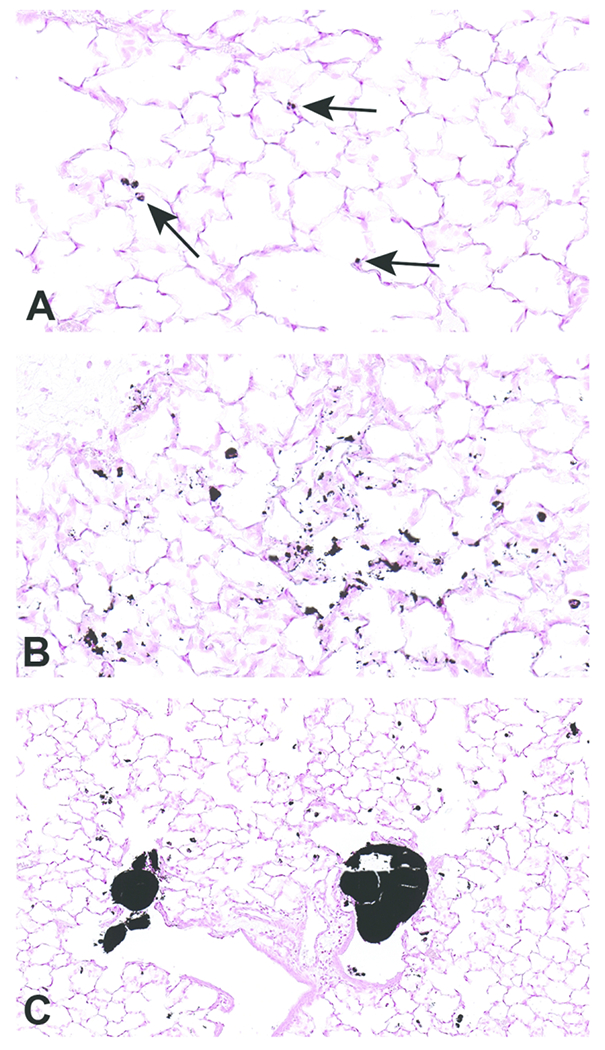
Figure 6.

Scanned images of lung pathology following exposures to carbon black treated with air (CB-Air; A) or ozone (CB-O3; B). Figures 6A and 6B are higher magnification images (original scans at 40x) of figures 5A and 5B, respectively. Particles in A are indicated with arrows. There was an increased number and size of particles in CB-O3 (B) lungs compared to CB-Air (A) lungs. Figure C illustrates the scattered larger particles in CB-O3 lungs (original scan at 20x). The larger aggregates were predominately in the terminal bronchi and alveolar ducts. Tissues were stained with Prussian blue to better illustrate the particles.
