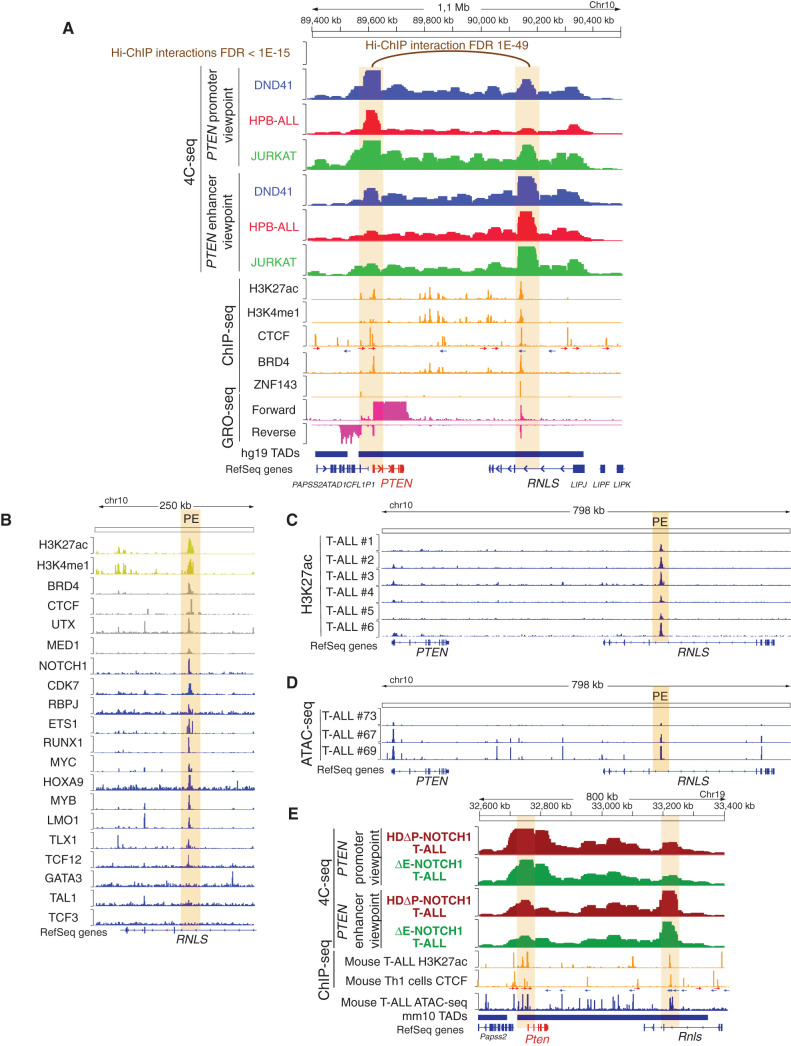
Figure 1.
Identification of PE, a PTEN enhancer in T-ALL. A, H3K27ac Hi-C chromatin immunoprecipitation (Hi-ChIP), 4C-seq, chromatin immunoprecipitation sequencing (ChIP-seq), GRO-seq, and Assay for Transposase-Accessible Chromatin using sequencing (ATAC-seq) tracks in human T-ALL cells. Top track shows H3K27ac Hi-ChIP interactions with the PTEN promoter in CUTLL1 T-ALL cells at FDR < 1E-15. Upper tracks show 4C-seq data in DND41 (blue), HPB-ALL (red), or JURKAT (green) T-ALL cells, using either the PTEN promoter or the PE enhancer as the viewpoints. 4C signal is merged across three independent replicates per condition. Middle tracks show ChIP-seq analyses in different T-ALL cell lines for the presence of epigenetic marks or enhancer-associated factors (orange). CTCF motifs are indicated by arrows (red arrow: forward core motif, blue arrow: reverse core motif). Lower tracks show GRO-seq data from CUTLL1 cells (pink). Bottom track shows the PTEN TAD (hg19). The PTEN promoter and the PE enhancer are highlighted by orange columns. B, Analysis of epigenetic marks (yellow), epigenetic factors (gray), and transcription factor (blue) PE occupancy by ChIP-seq in human T-ALL cells. PE enhancer is highlighted by an orange column. C, H3K27ac mark by ChIPmentation around the PE enhancer (highlighted in orange) in six independent human primary T-ALLs. D, ATAC-seq profile around the PE enhancer (highlighted in orange) in three independent human primary T-ALLs (GSE124223). E, 4C-seq, ChIP-seq, and ATAC-seq tracks in mouse T-ALL cells. Upper tracks show 4C-seq data from NOTCH1-induced mouse primary T-ALLs driven by either a NOTCH1-HDΔP construct (brown) or a NOTCH1-ΔE construct (green), using either the Pten promoter or the PE enhancer as the viewpoints. 4C signal is merged across three independent replicates per condition. Middle tracks show ChIP-seq (orange) of H3K27ac mark in mouse T-ALL cells and CTCF binding in mouse Th1 cells. CTCF motifs are indicated by arrows (red arrow: forward core motif, blue arrow: reverse core motif). Lower tracks show ATAC-seq data from a mouse primary T-ALL (blue), as well as the track showing the Pten TAD (mm10). The Pten promoter and the PE enhancer are highlighted by orange columns.

