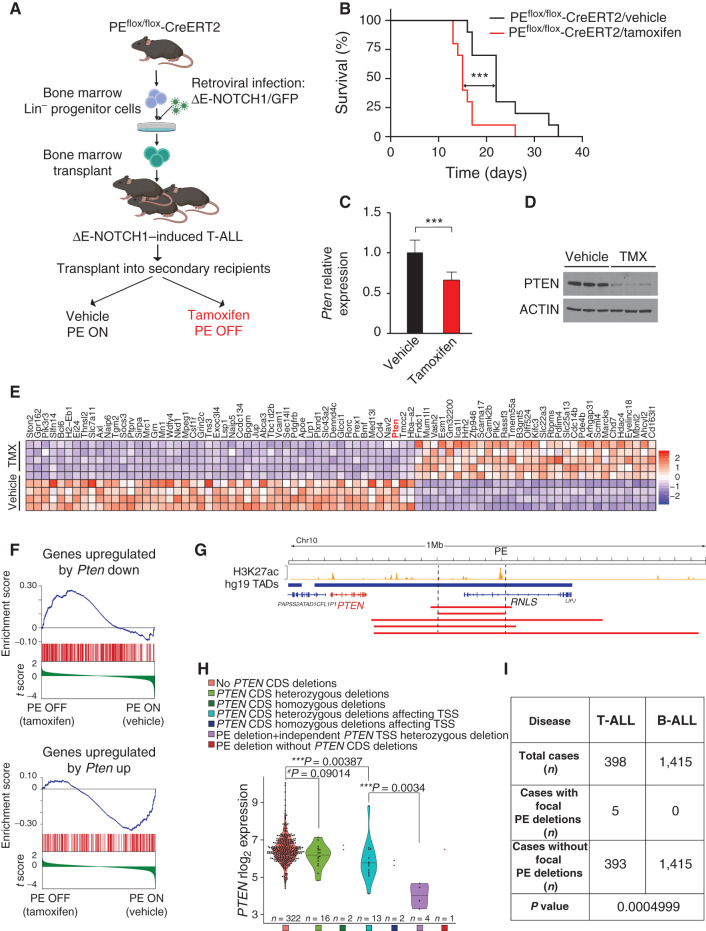
Figure 6.
Secondary loss of PE leads to accelerated NOTCH1-induced T-ALL progression and reduced levels of PTEN in mouse and human T-ALL.A, Schematic of retroviral-transduction protocol or the generation and analysis of PE conditional knockout NOTCH1–induced T-ALL. B, Kaplan–Meier curves of mice transplanted with PE conditional knockout ΔE-NOTCH1–induced T-ALL and treated in vivo with vehicle (control) or tamoxifen to induce isogenic deletion of PE. ***, P ≤ 0.005 values calculated using the log-rank test. C, Quantitative RT-PCR analysis of Pten expression in tumor cells isolated from PE conditional knockout leukemia–bearing mice treated with vehicle only (n = 7) or tamoxifen (n = 8) in vivo. Graph shows the mean values, and the error bars represent the SD. ***, P ≤ 0.005 was calculated using two-tailed Student t test. D, Western blot analysis of PTEN expression in tumor cells isolated from PE conditional knockout leukemia–bearing mice treated with vehicle only (n = 3) or tamoxifen (TMX; n = 3) in vivo. E, Heatmap representation of the top 81 differentially expressed genes between control- and tamoxifen-treated PE conditional knockout NOTCH1–induced leukemias. Cutoffs used: Wald statistic < −5 or > 5; P-adjusted value < 1E-04; sorted based on mean expression levels in tamoxifen-treated samples (for full list of significantly downregulated genes upon tamoxifen treatment, see Supplementary Fig. S12A). The scale bar shows color-coded differential expression, with red indicating higher levels of expression and blue indicating lower levels of expression. F, GSEA of genes regulated by PTEN in vehicle only–treated compared with tamoxifen-treated PE conditional knockout NOTCH1–induced leukemia cells in vivo. G, H3K27ac ChIP-seq mark in DND41 T-ALL cells along the PTEN-containing TAD and schematic representation of chromosome 10q23 focal deletions (red bars) found in human T-ALL. H, PTEN mRNA expression levels in human primary T-ALL samples (n = 360). Samples are subdivided according to the presence/absence of PTEN CDS deletions, the presence/absence of PTEN CDS deletions affecting its TSS, and the presence/absence of PE focal deletions. P value was calculated using t test. rlog, regularized log-transformed. I, PE focal deletions found specifically in T-ALL but not B-ALL. P value calculated using Fisher exact test.

