
Fig. 2. Emissivity data from Fig. 1 down-sampled to the filters used by the VEM (36).
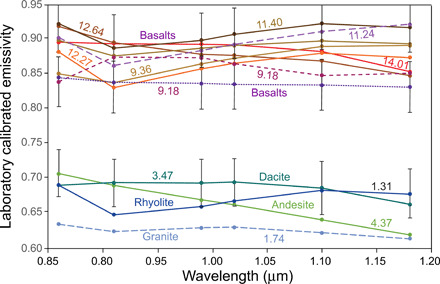
The five spectral windows between 0.86 and 1.18 μm in the atmosphere of Venus are mapped with six filters (the 1.02-μm window being sampled by two filters). Numbers indicate wt % FeO and dashed lines indicate particles with ranges of grain sizes: 700 to 1000 μm (long dashes), >500 μm (medium dash), and 250 to 500 μm (dots). Error bars added to select samples represent a conservative assumption on the uncertainty of ±4% for the retrieval of emissivity from orbit including instrumental and atmospheric effects and show that variations in rock composition can be determined from orbit. Errors on laboratory measurements are smaller than symbols.