
Fig. 4. Wavelengths of bands used opportunistically around gaps in the CO2 atmosphere of Venus (54).
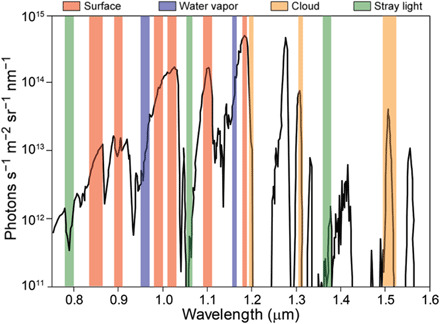
Collectively, these offer a comprehensive sampling of surface, water vapor cloud opacity, and stray light, as needed to estimate errors on surface bands. The black line is an observed nightside emission spectrum of Venus.