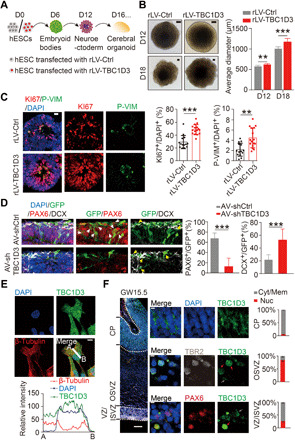
Fig. 1. Overexpression of TBC1D3 induces human cerebral organoid expansion.

(A) Schematic diagram for human cerebral organoid culture. (B) Analysis for the size of organoids (Ctrl, 6 organoids in D12 and 15 in D18; TBC1D3, 11 organoids in D12 and 17 in D18). Scale bars, 100 μm. (C) Analysis for the percentage of KI67+ or P-VIM+ cells in D18 organoids (14 neuroepithelial rosettes from 6 control organoids; 16 rosettes from 8 TBC1D3 organoids). Scale bar, 20 μm. (D) Analysis for the percentage of PAX6+ (white arrowheads) or DCX+ (yellow arrowheads) cells among GFP+ cells in D40 organoids infected with adenovirus (AV) expressing shTBC1D3 or shCtrl. Scale bar, 20 μm. shCtrl, 23 rosettes from 15 organoids; shTBC1D3, 19 rosettes from 13 organoids. (E) TBC1D3 distribution in ReN cells. Scale bar, 10 μm. (F) Immunostaining for PAX6, TBR2, and TBC1D3 in GW15.5 fetal human cortex. Scale bars, 200 μm (left) and 5 μm (magnified). Histograms show the percentage of cells with TBC1D3 enriched in cytoplasm/membrane (Cyt/Mem; gray arrows) or nucleus (Nuc; red arrows). Five regions for cortical plate (CP) or OSVZ; six regions for VZ/ISVZ from three slices. Data are presented as means ± SD, unpaired Student’s t test. **P < 0.01; ***P < 0.001.
