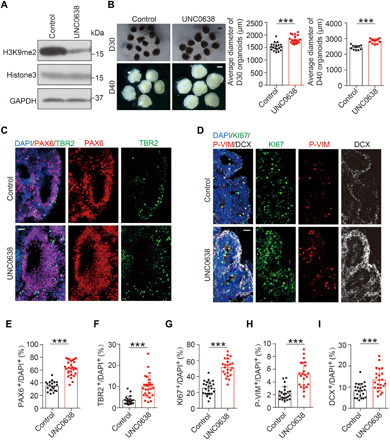
Fig. 3. Effects of G9a inhibition on cortical expansion in human cerebral organoids.

(A) Levels of H3K9me2 in D16 cerebral organoids treated with G9a inhibitor UNC0638 or DMSO control, determined by IB. (B) Representative images of D30 and D40 cerebral organoids treated with UNC0638 or vehicle control and quantification for the average diameter. Numbers of organoids analyzed: D30, 19 organoids for control and 20 organoids for UNC0638 group; D40, 11 organoids for control and 12 organoids for UNC0638 group. Scale bar, 1000 μm. (C) Immunostaining for signals of PAX6, TBR2, and DAPI in D30 organoids treated with UNC0638 or DMSO. Scale bar, 50 μm. (D) Immunostaining for signals of KI67, P-VIM, and DCX in D30 organoids treated with UNC0638 or DMSO control, with DAPI marking cell nucleus. Scale bar, 50 μm. (E and F) Quantification for the percentage of PAX6+ cells (E) or TBR2+ cells (F) among DAPI+ cells (20 rosettes from 14 control organoids; 31 rosettes from 17 UNC0638-treated organoids). (G to I) Quantification for the percentage of KI67+ (G), P-VIM+ (H), or DCX+ cells (I). Twenty-three rosettes from 15 organoids were analyzed in each group. Data are presented as means ± SD, unpaired Student’s t test. ***P < 0.001.
