
Fig. 5. Blockade of TBC1D3 interaction with G9a attenuates NP proliferation.
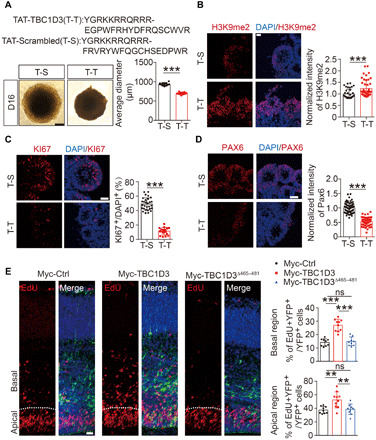
(A) Blockade of TBC1D3/G9a interaction with peptides suppresses organoid growth. At least 14 organoids were analyzed in each group. Scale bar, 200 μm. (B) H3K9me2 signals in D16 organoids. Data are represented as means ± SD of 25 rosettes from 9 T-S organoids and 33 rosettes from 12 T-T organoids, with average value of T-S group normalized as 1. Scale bar, 20 μm. (C) Analysis for the percentage of KI67+ in D16 organoids (29 rosettes from 7 T-S organoids; 16 rosettes from 6 T-T organoids). Scale bar, 40 μm. (D) PAX6 signals in D16 organoids. Normalized intensity of PAX6 was quantified with the value of T-S group set as 1 (79 rosettes from 6 T-S organoids; 49 rosettes from 6 T-T organoids). Scale bar, 40 μm. (E) Proliferative cells marked by EdU in mouse cortex transfected with indicated plasmids and yellow fluorescent protein (YFP). Histograms indicate percentage of EdU+ cells among YFP+ cells (9 embryos in the Myc-Ctrl or Myc-TBC1D3Δ465–481 group; 10 embryos in the Myc-TBC1D3 group). Scale bar, 20 μm. Data are presented as means ± SD, unpaired Student’s t test. **P < 0.01; ***P < 0.001; ns, no significant difference.