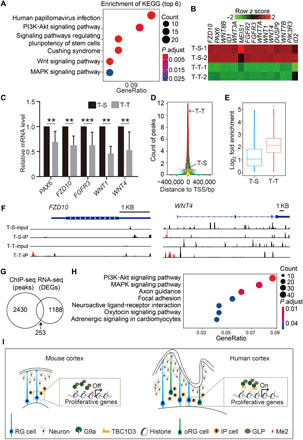
Fig. 6. Blockade of TBC1D3 interaction with G9a down-regulates expression of genes associated with NP proliferation.

(A) Top six enriched KEGG pathways by clustering analysis of down-regulated genes in T-T groups compared with T-S groups. (B) Heatmap showing representative down-regulated genes in T-T–treated organoids. (C) Relative mRNA levels of indicated genes to GAPDH measured by quantitative PCR analysis for D16 organoids treated with T-T or T-S peptides. Data are presented as means ± SD of at least five experiments in each group with values from T-S group normalized as 1. Unpaired Student’s t test. **P < 0.01; ***P < 0.001. (D) ChIP-seq showing the count and distribution of peaks around TSSs in T-S– or T-T–treated organoids at D16. (E) H3K9me2-binding peaks increase in T-T–treated organoids. (F) Genomic tracks showing differential H3K9me2 enrichment regions near TSS of FZD10 and WNT4. (G and H) Venn diagrams (G) and GO biological enrichment analysis (H) of genes corresponding to ChIP-seq peaks and DEGs identified by RNA-seq. (I) A proposed model showing a role of TBC1D3 in promoting NP proliferation and cortex expansion through down-regulating the level of H3K9me2. PI3K, phosphatidylinositol 3-kinase.
