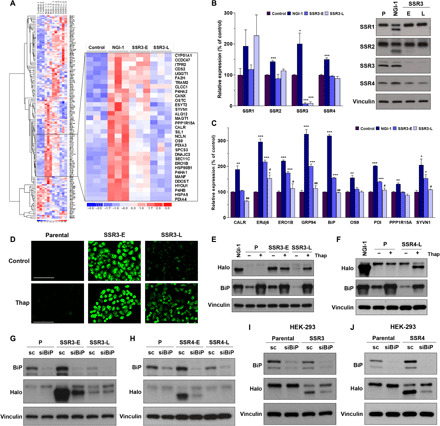
Fig. 5. Homeostasis of N-linked glycosylation via modulating ER stress response.

(A) RNA-seq results from three independent samples of A549 control cells compared to 10 μM NGI-1 treatment for 24 hours, SSR3-E cells, and SSR3-L cells. The inset identifies ER genes with enhanced expression in SSR3-E and reduced expression in SSR3-L. (B) The expression of TRAP subunits was compared between SSR3-E and SSR3-L cells. Parental and NGI-1–treated cells were used as the control cells. (C) RNA-seq results of genes involved in ER stress and the unfolded protein response pathways. *P < 0.05, **P < 0.01, and ***P < 0.001 (compared with control); #P < 0.05 and ##P < 0.01 (SSR3-E versus SSR3-L). (D) Effects of thapsigargin (Thap) treatment (100 nM, 24 hours) on N-linked glycosylation in SSR3-L KO cells as measured by induction of fluorescence in A549 Halo-1N cells (scale bars, 100 μm) and (E) hypoglycosylation of Halo1N by Western blot. (F) Effects of thapsigargin on glycosylation in SSR4-L cells by Western blot. BiP was used as the indicator for ER stress induction. (G and H) Effects of BiP knockdown with siRNA on Halo1N glycosylation in SSR3-E and SSR4-E, scramble (sc) siRNA was used as the control. (I and J) BiP knockdown improves N-linked glycosylation in both HEK-293 SSR3 KO and SSR4 KO cells. The Western blots are representative figures from at least two independent experiments.
