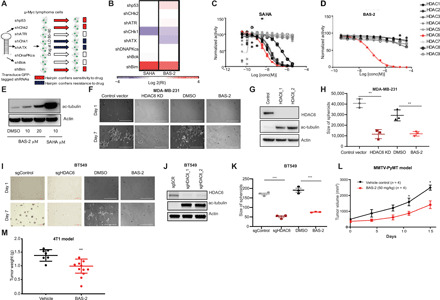
Fig. 2. Functional genetic approach to establish the target of BAS-2.

(A) Schematic of the GFP-based competition assays. LD, lethal dose. (B) Heatmap showing the response of cells expressing the indicated shRNAs to SAHA and BAS-2. (C and D) Inhibition of trifluoroacetyllysine substrate processing by suberoylanilide hydroxamic acid (SAHA) (C) and BAS-2 (D) (mean of triplicate measurements). (E) Western blot for acetylated tubulin following indicated treatments with BAS-2 and SAHA. (F) Images of MDA231 cells grown in Matrigel for 7 days with HDAC6 KD or following treatment with 30 μM BAS-2. (G) Western blot of HDAC6 and acetylated tubulin levels in control and HDAC6 KD cells. (H) Dot plots show the size of colonies in all treatment groups (n = 3, mean ± SEM). (I) Images of BT-549 cells grown as described in (F). (J) Western blot of HDAC6 and acetylated tubulin levels in control or HDAC6 KO cells. (K) Dot plots show the size of colonies in all treatment groups (n = 3, mean ± SEM). (L) MMTv-PyMT tumors were measured and plotted as average total tumor burden following randomization to vehicle [dimethyl sulfoxide (DMSO)] or BAS-2 (50 mg/kg; n = 4, mean ± SEM). (M) BALB/cJ mice were subcutaneously inoculated with 4T1 cells and treated with BAS-2 (50 mg/kg) for 14 days, and tumor weight was plotted (n = 10, mean ± SEM). **P < 0.01 and ***P < 0.001.
