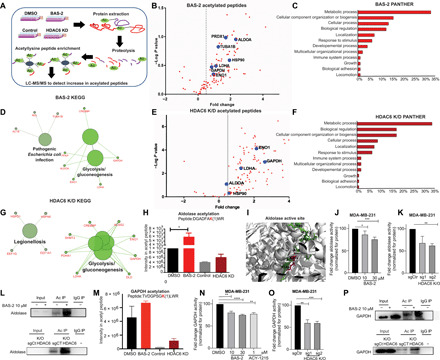
Fig. 3. Quantitative proteomics of the BAS-2 acetylome and HDAC6 KD converges on the glycolytic pathway.

(A) Proteomics workflow. (B) Volcano plot showing enhanced acetylated peptides following BAS-2 treatment (30 μM) for 48 hours. (C) Bar graph of biological pathways with increased acetylated peptides, as assessed by Panther (C) and as assessed by KEGG pathway (D). (E to G) The same as (B) to (D) but for HDAC6 KD compared with control. (H) Bar graph representing intensity of acetyl peptide of aldolase following BAS-2 treatment or HDAC6 KD. (I) Image of aldolase crystal structure extracted from the Protein Data Bank. The peptide from (H) shown in green (inserted by Pymol), and the lysine residue that is acetylated is in pink. (J and K) Measurement of aldolase enzymatic activity in MDA231 cells following 24-hour BAS-2 treatment (J) and following HDAC6 KO (K). (L) Western blots for immunoprecipitated (IP) acetylated proteins in MDA231 cells following BAS-2 treatment (10 μM) for 24 hours or with HDAC6 KO. IgG, immunoglobulin G. (M) Bar graph representing intensity of the acetyl peptide of GAPDH following BAS-2 treatment or HDAC6 KD. (N and O) Measurement of GAPDH enzymatic activity in MDA231 cells following 24-hour BAS-2 treatment (N) and HDAC6 KO (O). (P) Western blots for immunoprecipitated acetylated proteins in MDA231 cells following BAS-2 treatment (10 μM) for 24 hours or with HDAC6 KO (n = 3, mean ± SEM). *P < 0.05, **P < 0.01, and ***P < 0.001.
