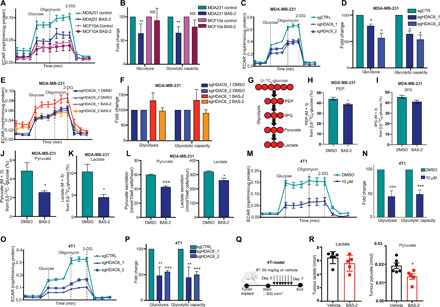
Fig. 5. Chemical inhibition and knockout of HDAC6 reduces glycolysis.

(A) Representative ECAR traces (mpH min−1 μg−1 of protein) are shown (mean ± SEM) for MCF10a (n = 2) and MDA231 (n = 4) cells treated with DMSO or BAS-2 (10 μM) for 24 hours. (B) Fold change in glycolysis and glycolytic capacity (n = 2/4, mean ± SD). NS, not significant. (C and E) Representative ECAR traces for MDA231 cells following HDAC6 KO (C) and treated with BAS-2 (10 μM) for 24 hours (E). (D and F) Fold change in glycolysis and glycolytic capacity (n = 3, mean ± SEM). (G) MDA231 cells were traced with 10 mM U13C6 glucose following 10 μM BAS-2 treatment for 24 hours. (H to K) Percentages of phosphoenolpyruvate (PEP; M + 3) (H), 3-phosphoglyceric acid (3PG) (M + 3) (I), pyruvate (M + 3) (J), and lactate (K) from glucose are shown (n = 3, mean ± SEM). (L) Lactate and pyruvate secreted from MDA231 cells treated with 10 μM BAS-2 for 24 hours (n = 3, mean ± SEM). (M) Representative ECAR traces for 4T1 cells treated with DMSO or BAS-2 for 24 hours. (N) Fold change in glycolysis and glycolytic capacity (n = 3, mean ± SEM). (O) ECAR values (mpH min−1 μg−1 of protein) shown for 4T1 following HDAC6 KO. (P) Fold change in glycolysis and glycolytic capacity (n = 3, mean ± SEM). (Q) Schematic of in vivo experiment. (R) Metabolites extracted from tumors were analyzed (n = 5, mean ± SD). *P < 0.05, **P < 0.01, and ***P < 0.001.
