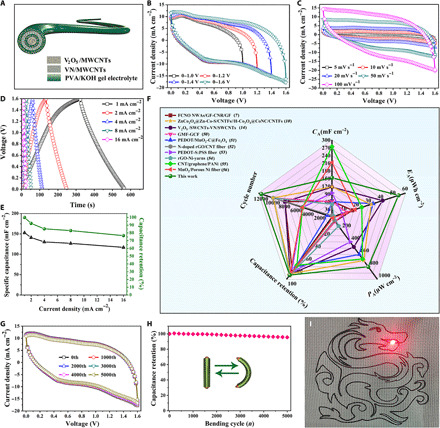
Fig. 4. Electrochemical performance of the 3D printing coaxial FASC device.

(A) Schematic diagram of the assembled device. (B) Cyclic voltammetry (CV) curves of the obtained device operated under different voltage windows. (C) CV curves of the device at different scan rates. (D) Galvanostatic charge/discharge (GCD) curves of the device at different current densities. (E) Rate capability of the device. (F) Comparison of electrochemical performance of this 3D printing coaxial FASC device with previous FASC devices (7, 10, 14, 50–56). Note to the terminology: CA, areal specific capacitance; EA, areal energy density; PA, areal power density. (G) CV curves obtained at the different bending cycles at a scan rate of 75 mV s−1. (H) Capacitance retention after 5000 cycles. (I) Photograph of a red 1.5-V LED illuminated by a fully charged 3D printed coaxial FASC device. Photo credit: (I) Hongyu Lu, Xi’an University of Technology.
