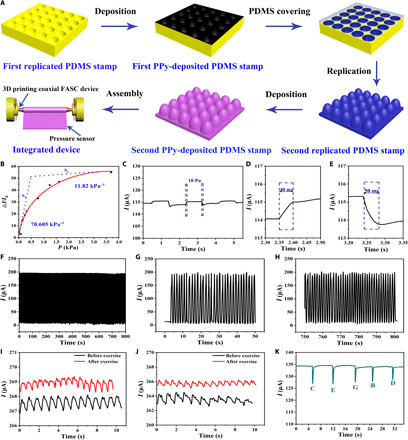
Fig. 6. The sensing performance of the as-fabricated self-energy monitoring system including the 3D printing coaxial FASC device and pressure sensor; the FASC device provide the power to the pressure sensor.

(A) Schematic diagram of the fabrication process of the self-energy monitoring system. (B) Sensitivity of the pressure sensor in the self-energy monitoring system. (C) Response signal of the pressure sensor under the 10-Pa pressure in the self-energy monitoring system. The response time of the pressure sensor was tested by placing a weight on the pressure sensor, which is covered by a glass slide to obtain a uniform pressure distribution firstly. (D and E) Magnified waveforms of the response/relaxation time extracted from (C), respectively. (F) Current change of the pressure sensor after repeated loading/uploading the 0.25-kPa pressure in this self-energy monitoring. (G and H) Magnified waveforms of the first 50 s and the last 50 s obtained from (F), respectively. (I and J) Response signal of the pressure for the fingertip and wrist pulses before and after exercise. The skin stickers were used to fix the pressure sensor on the fingertip and wrist to obtain a stable pulse signal. (K) Response signal of the pressure sensor for five different tones of kalimba piano.
