
Fig. 4. Percent experiencing harassment, by LGBTQ status.
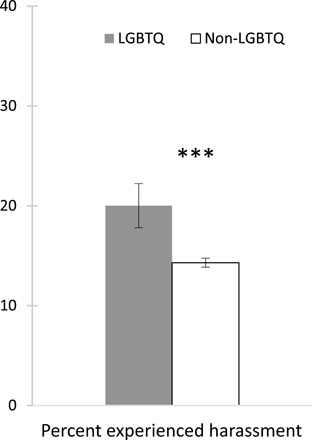
Predicted percentages for each category, holding constant variation by demographics, employment and job characteristics, and professional society. Scale represents percent of respondents in each category who experienced harassment at work at least once in the past year. Error bars represent 95% CIs. N = 25,324.