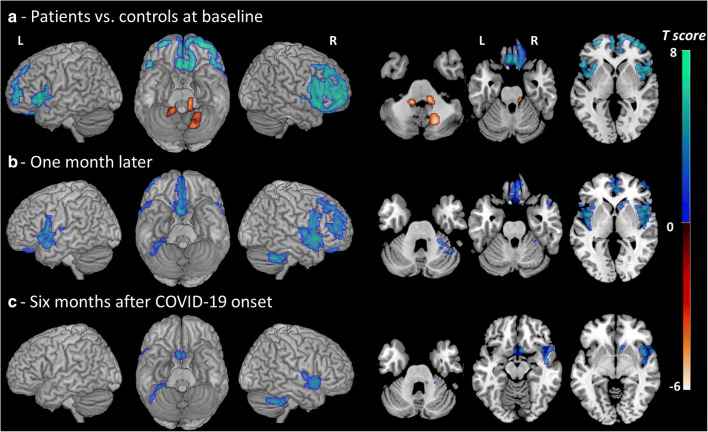
Fig. 1.
Brain metabolism changes in the whole group of patients (n = 7) vs. controls (n = 32) in the acute phase, 1 month later and 6 months after COVID-19 onset. Hot and cool color scales show regions with hypermetabolism and hypometabolism in patients vs. controls, respectively. The SPM maps are projected onto a surface rendering and onto axial views of the customized MRI template. The axial slices are shown using neurological conventions (right is right). R, right; L, left. At baseline, hypometabolism was found in the bilateral prefrontal cortex with right predominance, insula, anterior cingulate and caudate (p < 0.05 corrected). The analysis showed a mild hypermetabolism in the vermis, dentate nucleus and pons (p < 0.05). One month later, hypometabolism was limited to the mediofrontal, right dorsolateral areas, olfactory/rectus gyrus, bilateral insula, right caudate nucleus and cerebellum (p < 0.001). Six months after COVID-19 onset, metabolism decrease was observed in the same regions but they were less extended (p < 0.001)

