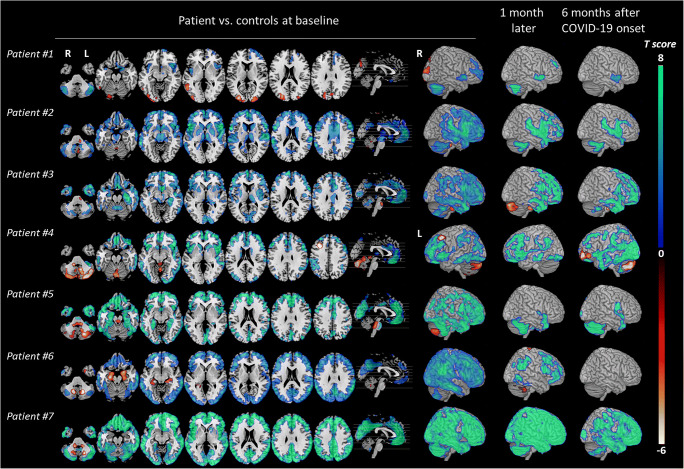
Fig. 2.
Brain metabolism changes in each patient vs. controls (n = 32) in the acute phase, 1 month later and 6 months after COVID-19 onset. SPM T maps generated from patient #1 to patient #7 are displayed with a hot color scale for brain hypermetabolism (p < 0.05) and with a cool color scale for brain hypometabolism (p < 0.05 corrected), in axial orthogonal views in neurological convention (right is right). R, right; L, left. 3D rendering shows for all patients the right hemisphere except in patient #4 who presented hypometabolism in the left frontal cortex due to focal seizure

