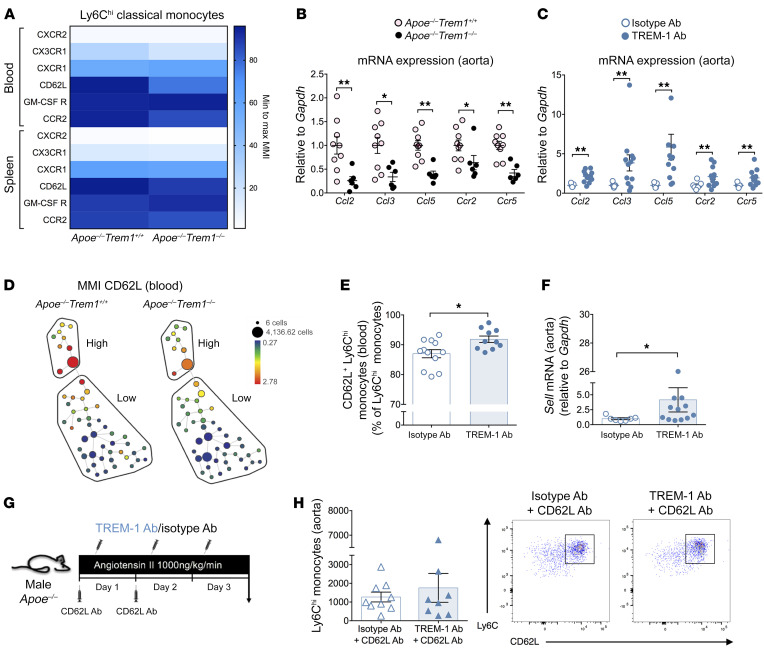
Figure 4. TREM-1 modulates Ly6Chi classical monocyte trafficking and recruitment in the aortic wall following AngII stimulation via CD62L.
(A) Heatmap representation of chemokine receptors and adhesion molecule expression (expressed as mean metal intensity [MMI]), measured by mass cytometry on classical monocytes in blood and spleen of Apoe–/–Trem1+/+ and Apoe–/–Trem1–/– mice 1 day after AngII infusion (n = 4/group). Quantification of Ccl2, Ccl3, Ccl5, Ccr2, and Ccr5 mRNA expression in aortas of AngII-infused (B) Apoe–/–Trem1+/+ and Apoe–/–Trem1–/– mice (n = 9 in Apoe–/–Trem1+/+ group, n = 6 in Apoe–/–Trem1–/– group) and (C) isotype-treated or TREM-1 Ab–treated Apoe–/– (n = 7 in isotype Ab group, n = 12 in TREM-1 Ab group) at day 7 after AngII infusion by RT-qPCR. (D) Representative SPADE tree plots of CD62L expression on classical Ly6Chi monocytes (High) and Ly6Clo monocytes (Low) in Apoe–/–Trem1+/+ and Apoe–/–Trem1–/– after 1 day of AngII infusion. (E) Flow cytometry analysis of CD62L expression on Ly6Chi classical monocytes (n = 12 in isotype Ab group, n = 10 in TREM-1 Ab group) (F) Quantification of Sell mRNA expression by RT-qPCR in the aorta of TREM-1 Ab–treated or isotype Ab-treated Apoe–/– mice after 3 days of AngII infusion (n = 7 in isotype Ab group, n = 12 in TREM-1 Ab group). (G–H) Apoe–/– mice were implanted with subcutaneous osmotic minipumps releasing AngII (1000 ng/kg/min) and were treated intravenously with a neutralizing anti–CD62L antibody (CD62L Ab, 100 μg/mice/d) during the first 2 days and received intraperitoneal injection of either an anti-TREM-1 Ab or an isotype Ab (control) for 3 days. (G) CD62L blockade was confirmed on Ly6Chi classical monocytes in the blood. (H) Quantification and representative dot plot of Ly6Chi classical monocyte infiltration in the aorta by flow cytometry after 3 days of AngII infusion (n = 9 in isotype Ab group, n = 8 in TREM-1 Ab group). Results are displayed as the mean ± SEM. *P < 0.05, **P < 0.01, by Mann-Whitney test.

