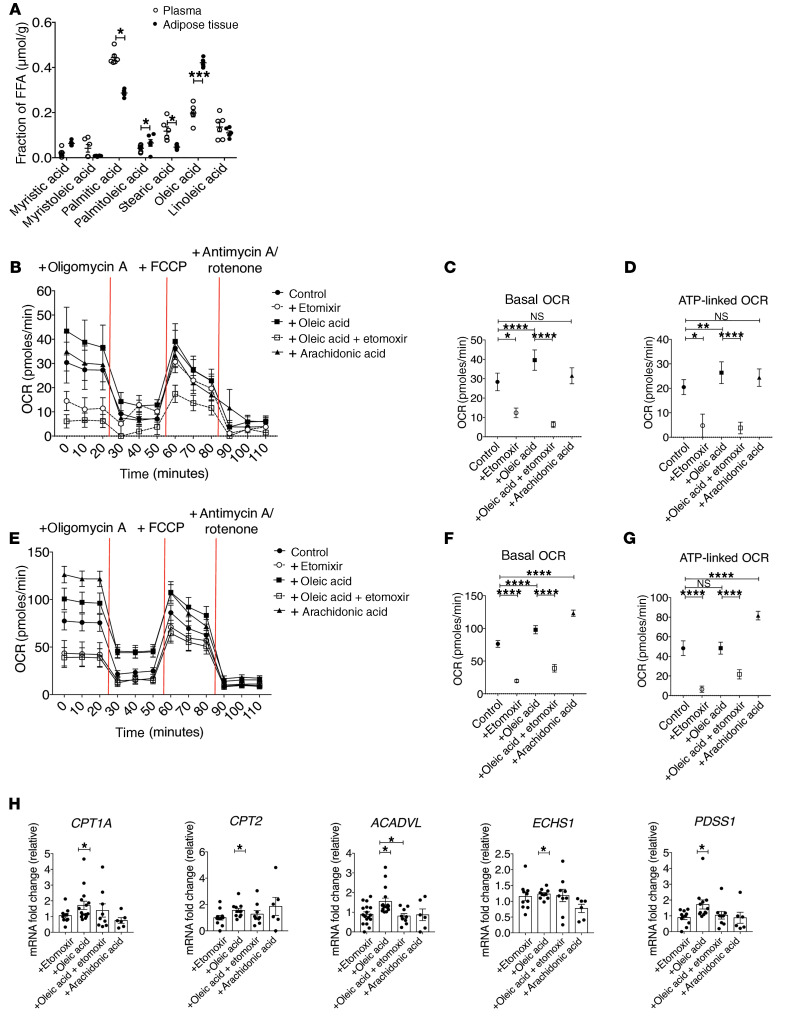
Figure 1. Oleic acid increases FAO in Tregs.
(A) Mass spectrometric analysis of LCFAs in supernatant from human adipose samples compared with blood plasma (n = 6). *P < 0.05 and ***P < 0.001, by paired Student’s t test. (B) OCR of Tregs stimulated for 72 hours in the presence or absence of etomoxir (50 μM), oleic acid (10 μM), oleic acid plus etomoxir, or arachidonic acid (10 μM) (n = 12). Summary of (C) basal OCR and (D) ATP-linked OCR of Tregs stimulated as in B (n = 12). *P < 0.05, **P < 0.01, and ****P < 0.0001, by paired Student’s t test corrected for multiple-hypothesis testing using the Holm-Sidak method. (E) OCR of Teffs stimulated as described in B (n = 12). Summary data for (F) basal OCR and (G) ATP-linked OCR of Teffs stimulated under the same conditions as in B (n = 12). ****P < 0.0001, by paired Student’s t test corrected for multiple-hypothesis testing using the Holm-Sidak method. (H) Fold change of mRNA expression relative to vehicle in Tregs stimulated for 72 hours as described in B. *P < 0.05, by paired Student’s t test corrected for multiple hypothesis testing using the Holm-Sidak method. Data represent the mean ± SEM.

