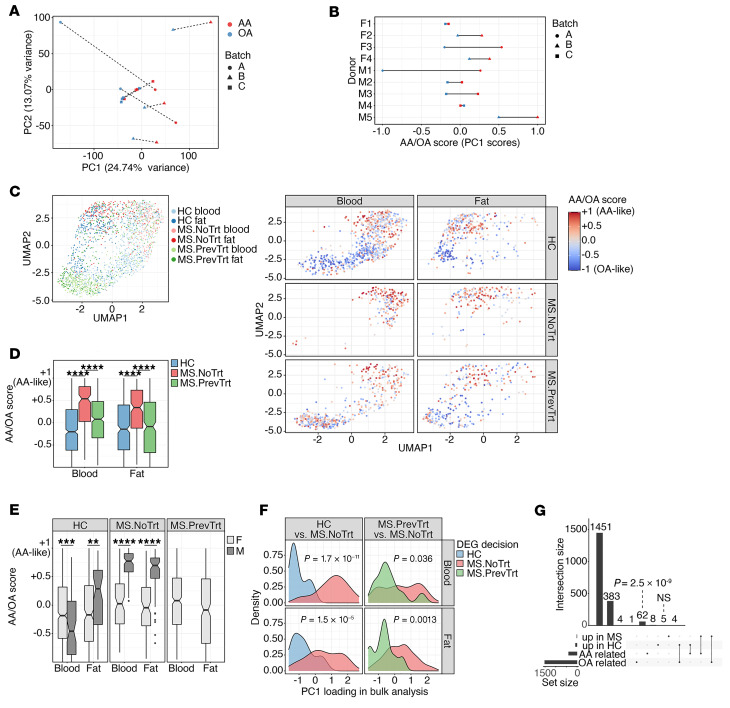
Figure 4. Oleic acid transcriptomic signature characterizes healthy but not MS Tregs.
(A and B) Tregs from peripheral blood of healthy donors were stimulated in the presence or absence of 10 μM oleic acid (OA) or arachidonic acid (AA). Each donor is represented by 2 dots, which correspond to the difference between oleic acid and the control or arachidonic acid and the control. (A) PCA was performed; each patient’s symbols are connected by a dashed line. Donors were partitioned into 3 separate date groups for tissue collection, denoted as batches (batch A took place over 2 consecutive days). (B) PC1 is scaled to [–1,1]; each line represents 1 donor (donor’s sex is indicated on the left). M1, male 1; F1, female 1. (C) Single-cell transcriptomes of Tregs were sorted from peripheral blood or adipose tissue of healthy donors (HC) or patients with MS and projected to a bidimensional space with UMAP (left). The same data are shown on the right, stratified by tissue and donor group. Colors indicate a computational signature of similarity to oleic acid– or arachidonic acid–stimulated blood Tregs (see the main text and Methods). (D and E) The computational signatures of single cells were aggregated and stratified by tissue, treatment group, and donor sex. Significance was determined by 2-sided Welch’s t test. (F) Densities of genes upregulated in healthy donors versus untreated patients with MS with respect to the loadings of PC1 shown in panel A (left) and a similar comparison of treated and untreated patients with MS (right). Significance was determined by 2-sided Welch’s t test. (G) Upset plot (101) showing the overlap of DEGs upregulated in healthy or MS (aggregating treated and untreated patients) states in the vivo single-cell RNA-Seq, and genes belonging to the oleic or arachidonic acid modules in the in vitro bulk RNA. The P value in G was calculated by hypergeometric enrichment test. NoTrt, no treatment; PrevTrt, previous treatment.

