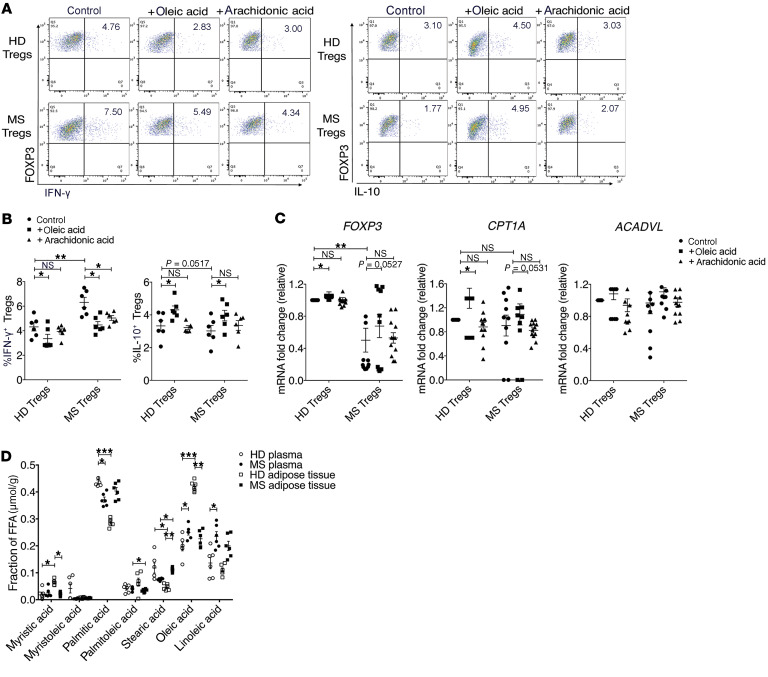
Figure 6. Oleic acid partially negates the MS Treg proinflammatory phenotype.
(A) Representative dot plot of healthy donor or MS Tregs sorted from frozen PBMCs and stimulated in the presence or absence of 10 μM oleic acid or arachidonic acid for 72 hours. Intracellular staining for IFN-γ (top) or IL-10 (bottom) was measured after a 4-hour stimulation with PMA and ionomycin in the presence of GolgiStop. (B) Summary of IFN-γ+ and IL-10+ healthy and MS Tregs after treatment with 10 M oleic acid or arachidonic acid for 3 days (n = 8). *P < 0.05 and **P < 0.01, by paired Student’s t test corrected for multiple-hypothesis testing using the Holm-Sidak method. (C) mRNA expression of the indicated genes relative to control, measured in the healthy and MS Tregs described in A (n = 10). *P < 0.05 and **P < 0.01, by paired Student’s t test corrected for multiple-hypothesis testing using the Holm-Sidak method. (D) Mass spectrometric analysis of LCFAs in supernatant from human adipose tissue samples compared with blood plasma of healthy donors or patients with MS (n = 6) *P < 0.05, **P < 0.01, and ***P < 0.001, by paired Student’s t test corrected for multiple-hypothesis testing using the Holm-Sidak method. Data represent the mean ± SEM.

